

Mexico’s Logistics Property Boom Gives Way to a More Selective Growth Cycle

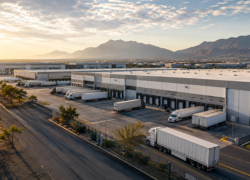
Mexico’s warehouse and industrial property market remained active during the second quarter of 2026, but the conditions that shaped the sector over the past several years are beginning to change. Companies continue to lease substantial amounts of space, while developers are reducing the pace of new construction and differences between the country’s major industrial regions are becoming increasingly pronounced. Mexico ended June with approximately 113.7 million square metres of industrial property, around 5.3% more than a year earlier, following several years of intensive construction driven by manufacturing investment, changing North American supply chains, e-commerce and growing domestic distribution requirements.

Demand remained healthy during Q2, with approximately 1.26 million square metres leased across the country, around 35% more than during the same period of 2025. More than half of this activity was concentrated in three markets. Monterrey represented approximately 24% of national leasing, followed by the Mexico City metropolitan region at around 22% and Tijuana at 11%. The increase provides an important indication that occupiers remain active despite greater uncertainty surrounding international trade and investment decisions.

Monterrey continues to benefit from its position as one of Mexico’s principal manufacturing centres. Production-related requirements accounted for the majority of major transactions during the quarter, with Apodaca and Santa Catarina remaining important destinations for occupiers and new projects. The region’s established industrial base, workforce and connections with the United States continue to support demand. Mexico City follows a different pattern. Its enormous population makes the metropolitan area primarily a distribution and consumption-driven market, with warehouses required to move goods through the capital and surrounding municipalities. Based on its share of national activity, approximately 278,000 square metres was leased in the wider Mexico City market during the quarter.

Development around the capital is increasingly moving northwards. More than one million square metres was being built across the wider metropolitan industrial market during Q2, equivalent to approximately one quarter of Mexico’s entire development pipeline. Zumpango accounted for around 60% of this construction, making the area around Felipe Ángeles International Airport an increasingly important part of the capital’s logistics map. Toluca represented around 16% of development, followed by Tultitlán at 12%, Huehuetoca at 8% and Cuautitlán at approximately 4%. The movement towards Zumpango also reflects the difficulty of finding large development sites in traditional warehouse districts, where limited land and higher prices are encouraging expansion further from central Mexico City.

Across Mexico, the amount of empty industrial property has increased as buildings started during the previous construction wave reach completion. Approximately 5.2% of national stock was vacant at the end of June, representing close to six million square metres. This remains relatively moderate but marks a significant change from the exceptionally tight conditions experienced in several Mexican markets earlier in the decade. Occupiers now have more alternatives, particularly in cities where developers added substantial amounts of new space.

The differences between individual markets are considerable. Tijuana recorded approximately 9.7% vacancy during Q2, while Monterrey and Reynosa were both close to 6.5% and Ciudad Juárez around 6.1%. Other industrial centres remain much tighter, with available space representing approximately 1% of stock in Aguascalientes, 2.1% in Puebla and 2.8% in Saltillo. Northern border markets remain important for companies supplying the United States, but their rapid expansion has given occupiers greater choice and means recently completed buildings can take longer to fill than during the period when available space was extremely limited.

Developers are already adjusting to this change. Slightly more than 3.8 million square metres was under construction nationally during the second quarter, approximately 20% below the level recorded a year earlier. The amount of development beginning during April and May was also around 25% lower than during the corresponding months of 2025. The reduction points towards a more cautious approach, with developers increasingly concentrating on locations where occupier requirements are already visible rather than relying heavily on expected future demand.

This slowdown could help restore balance during the coming quarters. Buildings already being developed will continue to increase inventory, but fewer projects beginning today should moderate the amount of additional supply reaching the market later. Rather than signalling the end of industrial expansion, the change suggests that the sector is moving towards a more measured development cycle after several years of rapid growth.

Rental levels have remained resilient despite greater availability. Average advertised industrial rents across Mexico stood at approximately USD 7.56 per square metre per month in May, almost 7% higher than a year earlier. Mexico City remains significantly more expensive at approximately USD 10.37 per square metre per month, reflecting limited land, intense distribution requirements and the value companies place on reaching the country’s largest consumer market. Tijuana followed at around USD 8.67.

The persistence of relatively high rents alongside rising vacancy indicates that occupiers are becoming more selective rather than simply reducing their requirements. Newer warehouses with efficient loading facilities, sufficient electricity, good motorway connections and proximity to major customers continue to attract stronger interest. Electricity infrastructure is becoming particularly important as larger manufacturing operations and increasingly sophisticated logistics facilities require substantial power capacity, making reliable supply an important factor in both occupier and development decisions.

Mexico’s industrial growth is also becoming broader than the relocation of manufacturing closer to the United States. Cross-border production remains important, particularly in Monterrey and northern Mexico, but domestic distribution, online retail and the logistics requirements of the country’s growing urban population are significant sources of demand in their own right. The distinction is particularly clear between Monterrey and Mexico City, with the former more closely linked to manufacturing and exports and the latter requiring enormous amounts of warehouse space to supply its population and businesses.

The market is consequently moving away from the unusually tight conditions that characterised the earlier expansion period and towards a more conventional balance between landlords and occupiers. Companies have more buildings to choose from, while owners must compete more actively for tenants in markets where supply has increased. Tijuana, Monterrey, Ciudad Juárez, Guadalajara, Mexico City and the industrial centres of central Mexico are increasingly following their own patterns of supply, construction and demand rather than moving together as a single national market.

Mexico entered the second half of 2026 with its industrial property sector still expanding, but the emphasis is changing from rapid construction towards more carefully targeted development. Leasing remains strong enough to support the market, while the reduction in new projects should give recently completed buildings time to attract tenants. Transport infrastructure, electricity, labour availability, proximity to consumers and connections with North American supply chains will increasingly determine which industrial corridors outperform.

After several years of exceptional expansion, Mexico’s warehouse and logistics market is therefore moving into a more selective stage rather than retreating. Strong occupier activity continues to support the sector, but future growth is likely to depend increasingly on building in locations where genuine demand and infrastructure can support additional supply.

Research & Analysis: CIJ.World

Mexico City Shopping Centres Stay Resilient as Spending Growth Cools

Mexico City’s retail property sector remained relatively stable during the second quarter of 2026, with established shopping centres maintaining high occupancy and retailers continuing to pursue selected expansion opportunities. The underlying consumer picture became less consistent as the quarter progressed, however, increasing the importance of location, visitor numbers and the overall quality of individual retail destinations.

The capital and its surrounding metropolitan area remain Mexico’s largest concentration of modern retail property. Market estimates indicate that the region contains approximately 8.1 million square metres of shopping-centre space, representing close to one third of the national total. This scale gives Mexico City a substantially larger retail base than any other Mexican metropolitan area and continues to make it the principal destination for brands entering or expanding within the country.

Occupancy among the stronger institutional shopping-centre portfolios remains high. Large property owners with significant exposure to Mexico City are generally reporting levels of around 94% to 95%. Across the wider Mexican retail market, occupancy is estimated at approximately 90%, suggesting that established centres in the capital are performing above the broader national market.

New construction continues but is more measured than in previous expansion periods. More than 800,000 square metres of retail property is currently being developed across Mexico, with part of this pipeline located in Mexico City and its metropolitan area. New supply increasingly forms part of larger developments combining shops with offices, residential accommodation, restaurants, entertainment and services.

This approach reflects changing consumer habits. Shopping centres are increasingly expected to provide reasons to visit beyond purchasing clothing or household goods. Restaurants, cafés, fitness facilities, entertainment, health services and everyday conveniences are becoming more important components of successful projects, helping landlords generate regular visits throughout the week.

Retailers continue to open stores, although expansion is becoming more targeted. Grocery operators, restaurants, specialist retailers and businesses connected with health, wellness and personal services have remained active. Brands are paying closer attention to local population density, household spending power, accessibility and existing visitor flows before committing to additional locations.

Rental levels continue to differ substantially according to property type and location. The average advertised retail rent across Mexico was approximately USD 28.93 per square metre per month at the end of the second quarter. The figure is a national benchmark rather than a Mexico City average, and the capital contains both significantly more expensive premium locations and considerably cheaper secondary space.

Polanco and Avenida Presidente Masaryk remain among the strongest destinations for luxury and international brands, benefiting from affluent local customers, tourism and a concentration of restaurants and hotels. Large regional shopping centres elsewhere in the metropolitan area rely more heavily on extensive residential catchments and their ability to combine shopping with entertainment and dining.

While property occupancy remained relatively strong, consumer spending became noticeably softer during the quarter. Comparable sales among retailers belonging to ANTAD increased 4.3% year on year in April before slowing to 0.8% in May and declining 1.6% in June.

Sales including recently opened stores performed better, increasing 6.6% in April, 3.0% in May and 0.6% in June. This indicates that continued store openings helped maintain overall revenue growth even as existing locations experienced more difficult trading conditions.

During the first six months of 2026, comparable sales increased by approximately 1.5%, while total sales including new stores grew by around 3.7%. ANTAD members generated approximately MXN 814 billion in sales during the period. Although these figures cover Mexico as a whole rather than Mexico City specifically, they provide an important measure of the consumer environment affecting retailers operating in the capital.

Performance also differed considerably between retail categories. Specialist businesses performed relatively well during parts of the quarter, while department stores experienced greater fluctuations. Consumers therefore appear to be adjusting their spending rather than reducing it evenly across all categories.

For property owners, this creates a greater need to manage the mix of businesses within their centres. Food, entertainment, fitness, healthcare and services can generate visits even when discretionary spending on products becomes more cautious. The ability to combine these uses with traditional shops is becoming increasingly important to maintaining customer numbers.

The result is a widening difference between successful centres and less competitive properties. Modern schemes in strong locations with established visitor flows are retaining retailers and attracting new concepts. Older centres that lack a clear identity, convenient access or a strong food and leisure offer face greater pressure to modernise and reposition.

Investment interest nevertheless remains present. Retail was identified as a preferred property sector by around 18% of respondents in a 2026 Mexican real estate investor survey, while Mexico City continued to rank as the country’s leading destination for property investment.

The outlook for the second half of 2026 is therefore one of stability rather than rapid expansion. Mexico City benefits from its enormous consumer base, concentration of higher-income households and continued interest from domestic and international retailers. High occupancy among established centres also limits the immediate risk of a significant increase in empty space.

Slower growth in consumer spending means landlords and retailers are likely to remain cautious. New stores will increasingly need to justify themselves through strong locations and reliable customer flows, while significant rental increases may be difficult to achieve outside the best-performing properties.

Mexico City’s retail market is consequently becoming less about adding shopping space and more about improving what already exists. The strongest properties are evolving into mixed destinations where shopping sits alongside restaurants, entertainment, fitness and everyday services. As this transition continues, the gap between centres capable of attracting regular visitors and those dependent on traditional shopping alone is likely to become one of the defining features of the market through the remainder of 2026.

Research & Analysis: CIJ.World

Mexico City Office Recovery Accelerates as Businesses Target Better Space

Mexico City’s office market strengthened further during the second quarter of 2026, with companies taking additional space, empty offices gradually returning to use and demand becoming increasingly concentrated in the capital’s leading commercial districts. Although a significant amount of office accommodation remains available across the city, the overall figures disguise a growing shortage of suitable modern space in some of the most desirable locations.

Research from several property advisers confirms the improving direction of the market, although individual statistics vary according to the types of buildings and geographical areas monitored. JLL calculated that occupied office space increased by approximately 131,500 square metres during the second quarter and put the share of vacant space at 18.3%. CBRE, which concentrates more heavily on modern higher-quality properties, recorded approximately 55,000 square metres of additional occupied space during the quarter and around 93,000 square metres during the first six months of the year. Its vacancy estimate stood at 17.6%.

Mexican property information provider Solili also recorded strong activity. Approximately 244,000 square metres of offices were leased across Mexico during the second quarter, with Mexico City responsible for around 64% of the total. This suggests that approximately 156,000 to 157,000 square metres of transactions took place in the capital during the three-month period.

The different measurements should not be compared directly. Leasing figures record agreements signed during a period, while changes in occupied space also account for premises that companies leave behind. Nevertheless, the various studies point towards the same underlying development: businesses are becoming more active and Mexico City is gradually working through the large amount of unused office space accumulated in previous years.

Depending on the buildings included in individual surveys, the proportion of available offices is currently estimated at roughly 17% to 20%. Solili put the figure at 17.1% at the end of June, while Colliers measured around 20% within the properties covered by its research. The variation illustrates why Mexico City is increasingly difficult to describe using a single citywide number.

The contrast becomes particularly clear at district level. Polanco, Reforma and Lomas Palmas are considerably tighter than the wider market. CBRE estimated that only around 10.6% of the offices within these central business locations were vacant. These areas continue to benefit from their established corporate environments, transport connections, restaurants, services and concentration of newer buildings.

Other parts of the city remain much more competitive from a tenant’s perspective. Solili calculated vacancy of approximately 31.4% in the Norte corridor, 25.1% in Santa Fe and 23.2% in Interlomas during the second quarter. Companies willing to consider these areas therefore continue to have substantially more choice than those concentrating exclusively on the central districts.

Insurgentes has been another important source of activity. According to CBRE, the corridor accounted for around 45% of the increase in occupied space recorded during the first half of 2026. Polanco, Reforma and Lomas Palmas together represented a further 36%. The figures demonstrate how heavily the recovery is concentrated in a relatively small group of locations.

Rental differences reflect the same pattern. Average advertised rents across Mexico City remain broadly stable, but prices vary considerably according to location and building standard. Solili calculated an average of approximately USD 21.37 per square metre per month at the end of June, while Colliers placed the average for the higher-quality buildings it monitors at around USD 23.

Lomas Palmas was among the most expensive districts, with advertised rents of approximately USD 25.22 per square metre per month. Reforma averaged around USD 23.84, followed by Polanco at USD 23.47 and Insurgentes at USD 22.64. Santa Fe remained lower at approximately USD 20.36, while Norte averaged around USD 17.71.

The differences suggest that the recovery is increasingly being determined by the type of office companies want rather than simply by the amount of space available. Businesses relocating or renegotiating leases are showing greater preference for modern buildings, efficient layouts, convenient transport access and locations offering services for employees. Offices that can be occupied without substantial additional investment are also attracting greater attention.

Technology and information technology companies have been particularly active. CBRE estimated that these businesses represented around 38% of the larger transactions it tracked during the first half of the year. Construction-related companies accounted for approximately 16%, while corporate service businesses represented around 11%.

At the same time, the development cycle is becoming more restrained. CBRE estimates that approximately 260,000 square metres of modern office accommodation is being developed across eight projects scheduled for completion between 2026 and 2029. Around 214,000 square metres could be completed during the second half of this year, primarily in Reforma, Polanco and Lomas Palmas.

A substantial portion of that future space has already found occupiers. JLL reported that approximately 41% of the offices under development and scheduled for completion during the second half of 2026 had been committed before opening. This reduces the amount of genuinely available new accommodation that will reach the market and could increase competition for the best buildings if corporate demand remains strong.

Solili follows a wider selection of projects and consequently calculates a construction total exceeding one million square metres. Despite the difference in coverage, its figures also show that developers are becoming more cautious. New office construction starts across Mexico during the second quarter were approximately 39% lower than a year earlier.

Mexico City nevertheless received a significant amount of new space during the quarter. Solili estimated that around 150,000 square metres of offices were completed across Mexico City and Monterrey, with approximately 94% of those completions located in the capital. This would put Mexico City deliveries at roughly 141,000 square metres.

The ability of the market to accommodate these additions while vacancy generally moved lower is an encouraging sign. It indicates that new corporate requirements are beginning to offset both recent construction and part of the older surplus that has weighed on the market since working patterns changed following the pandemic.

The slowdown in future construction could further improve the balance. Mexico City entered the previous decade with a substantial development programme, leaving the market particularly exposed when businesses subsequently reduced their office requirements. With considerably fewer projects now beginning construction, existing vacant buildings have more time to attract occupiers without competing against a continuous wave of new developments.

This is creating an increasingly divided market. Modern offices in Polanco, Reforma, Lomas Palmas and parts of Insurgentes are becoming more competitive as companies concentrate their searches in these districts. Older properties and buildings in areas with substantial vacancy still need to compete aggressively for tenants, particularly when significant refurbishment is required.

Mexico City therefore entered the second half of 2026 in a stronger position than it has occupied for several years. The city still has a considerable supply of empty offices, meaning tenants retain negotiating power across large parts of the market. However, this is becoming less true for companies requiring high-quality premises in the most sought-after locations.

If corporate demand remains at current levels while developers continue to limit new construction, the amount of unused space should decline further through the remainder of 2026. The next phase of Mexico City’s office recovery is likely to be increasingly shaped by a simple divide: plenty of offices remain available, but the buildings companies most want are becoming progressively harder to find.

Research & Analysis: CIJ.World

AI Integration Brings New Cybersecurity Duties as EU Reporting Deadline Approaches

Companies adding artificial intelligence to software and connected products will face new cybersecurity reporting requirements in the European Union from 11 September 2026, adding another layer of regulatory responsibility to the rapid adoption of AI across business applications.

The issue is becoming increasingly relevant as companies incorporate generative AI and other models into existing products, either through commercial application programming interfaces or publicly available models. While adding AI functionality has become technically straightforward, the resulting product can introduce new security dependencies and, in some circumstances, bring the company integrating the technology within the manufacturer obligations of the EU Cyber Resilience Act.

Under the CRA, a business that incorporates an AI model into a product with digital elements and markets that product under its own name can be responsible for meeting the regulation’s cybersecurity requirements. Companies making substantial modifications to products already on the market can also assume manufacturer responsibilities.

The implications extend beyond the AI model itself. Open-source models can introduce vulnerabilities through compromised files, dependencies or unsafe code, while externally hosted commercial models create different risks associated with their integration and reliance on third-party infrastructure.

Security researchers have demonstrated that apparently legitimate AI model files can contain malicious code capable of executing when a model is loaded. The source article cites research identifying around 100 malicious models on a major AI repository and approximately 350,000 unsafe or suspicious findings detected by a scanning partner across models examined on the platform.

Commercial AI services can reduce some of these risks by keeping the model outside the customer’s own infrastructure, but they introduce others. Applications processing emails, websites and documents can be vulnerable to indirect prompt injection, where malicious instructions embedded within external content influence an AI system and potentially cause unintended actions or disclosure of information.

Reliance on external AI providers can also create operational dependencies. Changes to models, interfaces or behaviour may alter assumptions on which an application’s security controls were originally designed, while outages or compromises affecting the provider can have consequences for products built around its services.

The regulatory timetable makes these issues increasingly immediate.

Most provisions of the Cyber Resilience Act become applicable on 11 December 2027, when manufacturers of covered products will face requirements concerning cybersecurity risk assessment, secure product development, vulnerability management, technical documentation and conformity procedures.

Certain reporting obligations arrive considerably earlier. From 11 September 2026, manufacturers will begin facing mandatory notification requirements concerning actively exploited vulnerabilities and severe security incidents affecting covered products.

For actively exploited vulnerabilities, manufacturers must provide an early warning through the CRA reporting mechanism without undue delay and, in any event, within 24 hours of becoming aware of the vulnerability. A more detailed vulnerability notification follows within 72 hours, while a final report is generally required within 14 days after a corrective or mitigating measure becomes available.

The timetable for severe incidents is similar but not identical, making it important that businesses establish procedures around the precise type of event rather than treating every CRA notification as following one universal reporting sequence.

The practical challenge is therefore not simply detecting a vulnerability. Companies need to establish which AI models and other software components are embedded within their products, their origins and versions, how they have been modified and who is responsible for escalating a security event when it occurs.

This becomes more complicated when products depend on multiple external components. Manufacturers cannot necessarily transfer regulatory responsibility simply because a vulnerability originated in third-party or open-source software incorporated into their own commercial product.

AI makes maintaining this visibility particularly important. Models can be replaced, updated or fine-tuned during a product’s lifetime, while the surrounding software can contain libraries, APIs and other dependencies that change independently. Maintaining an accurate inventory of these components will therefore become an increasingly important part of cybersecurity governance.

The CRA’s broader requirements will eventually reinforce this approach through lifecycle vulnerability management and technical documentation. Software bills of materials can help companies identify dependencies when a vulnerability emerges, while AI products may require similarly detailed records covering models and associated components.

The potential financial consequences are substantial. For breaches of some of the CRA’s principal requirements, penalties can reach EUR 15 million or 2.5% of worldwide annual turnover for the preceding financial year, whichever is higher, although the applicable maximum depends on the particular infringement.

For businesses rapidly adding AI features to existing products, the immediate question is therefore shifting from whether AI can improve functionality to whether the organisation understands the additional security architecture and regulatory responsibilities that accompany it.

With the first CRA reporting requirements taking effect on 11 September, companies operating in the EU have only a short period remaining to establish who monitors vulnerabilities, how incidents are assessed, which products are affected and who is authorised to make regulatory notifications.

The growing use of AI does not fundamentally change the principle behind the Cyber Resilience Act: companies placing digital products on the European market are expected to understand and manage their cybersecurity risks throughout the product lifecycle.

What AI changes is the complexity. A product can now depend on models, datasets, external services and software components that may evolve long after its initial release. For companies embracing AI across their product ranges, keeping track of those dependencies is becoming as important as adding the AI functionality itself.

Source: CMS

Danish Living Sector Takes 67% of Property Investment as Copenhagen Housing Prices Rise 23%

Denmark’s residential investment market remained the dominant part of the country’s commercial property market during the first half of 2026, accounting for 67% of total investment volume despite a modest decline in transaction value, according to CBRE.

Living-sector investment reached DKK 20.9 billion in H1 2026, down 6.5% compared with the same period last year. A total of 443 transactions above CBRE’s DKK 5 million threshold were recorded, while the largest individual transaction was valued at approximately DKK 2.1 billion. Cross-border investors accounted for DKK 6.6 billion of activity.

The 67% share of overall property investment is particularly significant when viewed against previous years. The chart on page one of the CBRE report shows residential property accounted for 52% of Danish investment volume in 2025, 47% in 2024 and 39% in 2023. The H1 2026 figure is therefore the highest share shown in CBRE’s series dating back to 2015.

CBRE describes residential property as relatively resilient despite geopolitical uncertainty and changing expectations for interest rates slowing transactions during the first half. Investor appetite continues to be supported by demand for predictable income and the underlying fundamentals of the Danish housing market.

Pricing also remained stable at the prime end of the investment market. Prime multifamily yields stood at 3.50% in Copenhagen at the end of Q2, while Aarhus and Greater Copenhagen were at 4.10%. Micro-living yields were 3.90%, while prime student housing stood at 4.20%.

Among the largest transactions during the first half was M&G Real Estate’s acquisition of the Banehaverne residential project from Urban Partners, AG Gruppen and Nordea Pension Ejendomme. Lærernes Pension also acquired the Trierhus and Gads Hus residential properties from Patrizia.

The underlying Copenhagen housing market is showing particularly strong pricing conditions. CBRE reports an average apartment sale price of DKK 66,463 per sqm in Copenhagen City, representing an increase of 23% year-on-year on its trailing 12-month measure. Prime annual multifamily rents, meanwhile, remained unchanged quarter-on-quarter at DKK 2,625 per sqm.

Residential construction activity has also increased. Construction starts in Copenhagen and Frederiksberg reached 976 private rental and owner-occupied units in Q1 2026, up 58% year-on-year, while 1,151 homes were completed, representing an increase of 185%.

However, the longer-term development picture remains constrained. The chart on page two shows the volume of housing under construction falling substantially from the peaks recorded around 2019-2021. The projected pipeline through 2027-2029 also remains relatively limited compared with those earlier levels.

This supply situation is supporting the performance of existing residential assets. CBRE identifies limited availability and sustained demand for well-located, higher-quality housing as important factors behind Copenhagen’s resilience, with the strongest pricing concentrated in neighbourhoods offering good transport connections and access to everyday services.

Location is becoming increasingly important. Mixed neighbourhoods where residents can reach workplaces, retail, services and public transport relatively easily are attracting premiums, while well-connected suburban locations are benefiting from comparatively lower housing costs and improving residential fundamentals.

International migration is another source of rental demand. CBRE notes that foreign residents remain an important contributor to Copenhagen’s demographic growth and that practical or regulatory barriers to home ownership for some expatriates concentrate a significant part of this demand in rental housing. This is supporting occupancy and rental-market conditions.

The combination of a 23% increase in average Copenhagen apartment sale prices, stable prime rents and a comparatively limited longer-term development pipeline highlights the pressure created by strong housing demand and restricted supply.

For investors, those conditions help explain why residential property has captured such a large share of Danish real estate capital in 2026. Although H1 investment volume was 6.5% below last year, the sector’s 67% share of total transaction activity indicates that living assets remain a central focus for investors seeking relatively defensive income.

The market is therefore entering the second half of 2026 with an unusual combination of slightly lower investment volume but stronger residential pricing and rising construction starts. Whether the recent increase in development activity develops into a sustained expansion of housing supply will be important for both investors and Copenhagen residents, particularly after the sharp rise in apartment prices recorded over the past year.

Beyond Panama City’s Skyline: The Uneven Distribution of a Growing Economy

Panama has created one of Central America’s most internationally connected economies, turning its geographical position into a powerful platform for global trade, logistics, banking, aviation and investment. Panama City provides the most visible evidence of that transformation, with its high-rise residential towers, corporate offices, luxury hotels and modern shopping centres presenting an image of considerable prosperity. Beyond the skyline, however, Panama is considerably more complex. Income, employment security, housing conditions and access to infrastructure vary sharply between communities, with the differences becoming even more pronounced between metropolitan, rural and indigenous areas.

Panama’s economy expanded by around 4.4 percent in 2025 and continued growing during the opening months of 2026. Economic output per person is approaching USD 20,000, placing the country in a relatively strong position within the region. Those national averages tell only part of the story. Income remains highly concentrated, while poverty varies enormously depending on location. Recent international assessments place Panama’s income inequality among the highest in Latin America, creating a significant difference between the prosperity visible in the capital and the economic circumstances experienced by much of the wider population.

Much of Panama’s wealth is concentrated around Panama City and the Canal corridor. Banking, maritime services, logistics, multinational businesses, professional services and property development have created a sophisticated economy that is particularly visible in Punta Pacífica, Punta Paitilla, Costa del Este, Marbella and parts of San Francisco. Luxury residential towers, international schools, private hospitals, restaurants and premium retail reinforce the impression of a city operating at a relatively high income level. This purchasing power, however, should not be confused with that of the average Panamanian household.

Large working populations live in San Miguelito, Panama Este, Panama Norte and increasingly Panama Oeste, where housing options, transport requirements and disposable incomes can be considerably different. The geographical distances separating these communities from Panama City’s wealthiest districts may be relatively small, but economically they can represent very different worlds.

Employment is one of the principal reasons for this divide. Panama has developed highly productive sectors around banking, maritime services, logistics, professional services and multinational companies, creating jobs capable of supporting property ownership, private vehicles and relatively high levels of consumption. At the same time, informal employment remains extensive. Official figures for 2025 indicate that approximately 785,000 people were working informally outside agriculture, representing around 47 percent of the workers covered by the measure.

Informality is particularly significant in construction, manufacturing, hospitality, transportation and commerce. This means that two people can both be economically active while having completely different levels of financial security. A professional employed by a bank or multinational company may have a predictable salary, social protection and access to conventional credit and mortgage financing, while someone working informally can find it considerably more difficult to demonstrate stable income or accumulate long-term financial security.

Education increasingly determines who can enter the stronger side of Panama’s economy. Logistics management, financial services, aviation, technology and multinational operations require professional, technical, digital and language skills. Families able to provide stronger education, English-language training and access to technology consequently give their children an important advantage. Panama therefore faces the risk of creating sophisticated new employment without ensuring that children from lower-income communities have an equal opportunity to compete for those positions.

The divide becomes substantially greater outside metropolitan Panama. Rural poverty remains several times higher than urban poverty, while conditions in the indigenous comarcas are dramatically different. Recent international estimates indicate that close to four out of every five people in Panama’s indigenous territories were living in poverty in 2024 under an internationally comparable measure. This creates an extraordinary contrast in a country operating one of the world’s most important trade routes and possessing a globally connected financial centre.

Some communities continue to face difficulties involving water, sanitation, electricity, transportation, healthcare and education. This goes beyond differences in household income. It represents unequal access to the physical and institutional infrastructure required to participate fully in the economy. The implications are particularly serious for children because differences in education, healthcare, nutrition, internet connectivity and transportation can influence earning potential for decades.

Housing provides another visible expression of Panama’s economic structure. Panama City has developed a substantial premium residential market supported by wealthy local households, international executives, expatriates and overseas investors. Waterfront towers and large master-planned communities have become an important part of the city’s international identity. Elsewhere, informal settlements and unresolved land ownership remain part of the housing landscape, with government programmes continuing to regularise communities where families have occupied and developed land without complete formal ownership.

Legal ownership has important economic consequences. A formally owned property can generally be sold, inherited, mortgaged or potentially used as collateral. A family may physically possess a home for many years without being able to use that asset in the same way if ownership remains unresolved. Panama can therefore contain an international investor purchasing an expensive waterfront apartment and, within the same metropolitan economy, families attempting to establish legal ownership of the land beneath homes they have occupied for years.

The rapid expansion of Panama Oeste adds another dimension to housing affordability. Arraiján, La Chorrera and surrounding areas have absorbed significant residential development as households search for alternatives to more expensive central locations. Greater availability of land has allowed the metropolitan region to expand westward, but cheaper housing can create another cost through longer journeys to employment.

Thousands of residents travel between Panama Oeste and Panama City, creating pressure on the principal road connections. A household may reduce its mortgage or rental costs by moving farther from the centre while substantially increasing the amount of time spent travelling. Long commutes affect family life, employment flexibility, education and productivity, demonstrating why housing affordability cannot realistically be considered separately from transportation.

Panama is investing heavily in roads and transport infrastructure to improve these connections. Major programmes include highway expansion, bridge construction, road rehabilitation and projects across Panama Oeste and other rapidly developing parts of the country. These investments also highlight a recurring development problem: urbanisation and housing construction can progress more rapidly than the infrastructure required to support them. Communities expand and commuting patterns become established before major transport capacity arrives.

Mass transit could have a particularly important long-term impact. Expansion of Panama’s metro system can connect lower-cost residential districts with employment centres without requiring every household to own a car. Better accessibility can also encourage commercial and residential development around stations and transform previously peripheral locations into viable development areas.

For real estate, these improvements can fundamentally change land values. A location that was previously considered too distant from employment centres can become significantly more attractive once travel times improve. New infrastructure can support housing, retail and commercial development while increasing surrounding property values. However, rapidly increasing land values can eventually make improving districts less affordable for existing residents, making the management of development around transport corridors increasingly important.

The apparent infrastructure difference between affluent and poorer communities also requires careful interpretation. High-end residential developments frequently provide their own internal roads, security, drainage, landscaping, parking and recreational facilities. Large commercial projects similarly create substantial amounts of privately financed infrastructure. An affluent neighbourhood can therefore appear dramatically better maintained without the entire difference resulting from higher public expenditure.

Higher-income households can also purchase alternatives when public infrastructure is inadequate. They can use private vehicles, private schools, private healthcare and professionally managed residential environments. Lower-income households are considerably more dependent on public roads, buses, schools, healthcare facilities, drainage and municipal services. Weak public infrastructure consequently has a greater impact on households with the least ability to avoid it.

Panama is nevertheless investing public money in lower-income communities as well as affluent areas. Infrastructure programmes extend through San Miguelito, Panama Este, Panama Norte, Panama Oeste and communities outside the metropolitan region. The more significant difference is often the condition from which these neighbourhoods begin. Providing infrastructure alongside a planned new development is considerably easier than retrofitting roads, drainage, utilities and public spaces into densely populated communities established decades earlier.

Retail provides another illustration of Panama’s different economic realities. The country benefits from its position as a major trading and distribution centre, its ports, the Colón Free Zone and a dollar-based economy. Imported goods are central to its commercial system, yet premium Panama City retail can still appear expensive relative to local wages. Higher-income Panamanians are joined by expatriates, international executives, tourists and business travellers, creating demand with considerably greater purchasing power than national averages might suggest. Luxury retail can therefore prosper without being financially accessible to most households.

International capital has played a similarly important role in the property market. Panama’s dollarised economy, strategic location, financial sector and international connections have historically made it attractive to overseas investors. Foreign investment helped finance the residential transformation of Punta Pacífica, Costa del Este and other districts while supporting construction, property services and employment.

International purchasing power can nevertheless become disconnected from domestic salaries. An apartment that appears reasonably priced to someone earning in the United States, Canada or Europe can remain unattainable for a household dependent on local wages. Similar pressures can emerge in tourism and second-home destinations outside Panama City. The challenge is not whether Panama should continue attracting international investment, but whether housing, infrastructure and employment can expand alongside it so successful locations remain economically connected with the people who work there.

Government finances create another constraint. Panama requires substantial investment in roads, public transport, water, sanitation, education and housing while simultaneously managing public debt and maintaining fiscal discipline. Partnerships with private capital can help finance commercially viable infrastructure, but they cannot provide every solution. Projects serving the poorest and most remote communities frequently cannot generate sufficient financial returns for commercial investors, leaving government expenditure particularly important in precisely the places where infrastructure can have the greatest social impact.

This is especially relevant in Panama’s indigenous territories. In remote communities, a road, bridge, reliable water supply, electricity connection or digital network can fundamentally alter economic possibilities. Better connections allow children to reach schools, patients to access healthcare and producers to transport goods to markets. Infrastructure in these areas is therefore not simply about improving living standards. It can determine whether communities can participate fully in the formal economy.

Panama has already demonstrated its ability to create substantial economic value. Its strategic position has become the foundation for one of the world’s most important logistics networks, while the country has developed an international financial centre, attracted multinational companies and transformed Panama City into one of Latin America’s most recognisable skylines. Strong economic growth, however, does not automatically produce equal opportunity.

Panama effectively contains several economies within the same borders. There is the internationally connected Panama of the Canal, banking, ports, logistics, skyscrapers and foreign capital. There is metropolitan working Panama extending through San Miguelito, Panama Este and Panama Oeste, where large numbers of households provide the workforce supporting the capital while managing housing and transportation pressures. There is rural Panama, where infrastructure and employment opportunities can be considerably more limited, and there are indigenous territories where poverty and access to basic services remain dramatically different from conditions in the capital.

For the real estate and investment industry, these differences have direct consequences. Household incomes determine housing affordability, employment security influences access to mortgages, transportation determines where workers can realistically live and infrastructure affects land values and development potential. Education determines the future workforce, while public investment can transform locations previously considered too difficult or remote for substantial private development.

Panama’s next stage of development may therefore look very different from the construction boom that created its skyline. The larger opportunity lies in housing, transportation and infrastructure capable of connecting more people with the economic activity already being generated.

Panama has demonstrated that it can use its position between two oceans to connect global markets. The more difficult task ahead is ensuring that the prosperity created by that connection reaches more evenly across the country itself.

Source: © CIJ.World Research & Analysis Team

Costa Rica’s Growth Story Reveals a Widening Gap Between Prosperity and Everyday Life

Costa Rica has developed one of Central America’s most successful and internationally connected economies, attracting multinational companies, tourism investment, advanced manufacturing and increasingly sophisticated real estate development. Yet travelling through the country reveals another side of that success. Expensive shopping centres, gated residential projects and prosperous business districts can sit surprisingly close to communities where household budgets are tight and public infrastructure remains under considerable pressure.

The contrast is particularly noticeable in Greater San José. Areas such as Escazú and Santa Ana have become centres for higher-income housing, international companies, private schools, healthcare, restaurants and modern retail. Elsewhere in the metropolitan area, households are considerably more dependent on public transport and municipal infrastructure, while differences in roads, drainage, pedestrian facilities and the overall quality of the urban environment can be substantial.

This does not make Costa Rica a straightforward story of rich against poor. The country has a sizeable middle-income population and has historically built much of its social stability around education, healthcare and public institutions. Poverty has also been declining. Official statistics show that the proportion of households below the national poverty threshold fell from 18 percent in 2024 to 15.2 percent in 2025, while extreme poverty declined to 3.8 percent.

However, moving above the official poverty threshold does not necessarily mean that a family has significant disposable income. Housing, food, transport and consumer goods can absorb a substantial share of earnings, while income remains unevenly distributed. Costa Rica’s Gini coefficient stood at 0.488 in 2025, demonstrating that considerable differences remain between households at opposite ends of the income scale.

Average household income reached approximately ₡1.21 million (approx. $2,657 USD) per month in 2025, but the national average conceals large variations. At the upper end of the economy are business owners, executives, professionals and internationally connected households with purchasing power capable of supporting premium property, private services and imported consumer goods. At the other end are families for whom relatively ordinary purchases can represent a significant proportion of monthly income.

This helps explain one of the more surprising aspects of Costa Rica for international visitors: the price of shopping.

Imported clothing, footwear, cosmetics, electronics and certain foods can be expensive compared with prices in larger European or North American markets. Costa Rica’s relatively small population limits the economies of scale available to retailers, while freight, customs, warehousing, local distribution and taxation all contribute to the final price. Most goods and services are also subject to the country’s 13 percent value-added tax.

International brands consequently operate within a market that is not necessarily designed around the purchasing power of the average household. Premium shopping centres can cater to higher-income Costa Ricans, tourists, expatriates and international professionals, while much of the wider population shops through supermarkets, local businesses, discount retailers, outlets, markets and promotional channels.

Employment adds another layer to the divide. Costa Rica has successfully attracted technology, medical-device, business-services and advanced-manufacturing companies offering professional employment and internationally competitive career opportunities. At the same time, approximately 824,000 people were estimated to be working informally during the first quarter of 2026, equivalent to 38.2 percent of the employed population.

The distinction matters because employment does not necessarily provide the same level of security for everyone. Formal professional employment can provide predictable salaries, access to credit and stronger social protection. Informal workers may experience greater fluctuations in income and more difficulty obtaining conventional financing, including mortgages.

Housing is where these differences become physically embedded in the country’s cities.

Higher-income households can choose modern condominiums and gated developments offering security, landscaping, recreational facilities and maintained common areas. Lower-income households face a much narrower range of choices determined by wages, land prices, mortgage availability and transport costs.

Property ownership also has consequences extending beyond housing itself. A family able to acquire property in an improving and well-connected district can accumulate wealth as land and housing values increase. Families unable to enter the ownership market do not benefit from property appreciation in the same way, potentially allowing today’s income differences to become tomorrow’s wealth differences.

The apparent infrastructure gap between neighbourhoods is similarly more complicated than simply comparing government spending between wealthy and poorer municipalities.

Costa Rica is investing public money in communities across the income spectrum. Major programmes include roads, bridges, schools, flood protection and other resilience projects, with infrastructure improvements underway in communities that would not normally be considered affluent.

However, neighbourhoods do not all begin from the same position. Some communities expanded before adequate roads, drainage, pavements and other infrastructure were available, leaving authorities with the much more difficult and expensive task of improving established urban areas.

Newer high-income developments can operate very differently. Residential developers frequently provide roads, drainage, landscaping, security and recreational facilities within their projects. Shopping centres, office developments and mixed-use schemes also create substantial amounts of privately financed infrastructure.

As a result, an affluent neighbourhood may appear to have received far greater public investment when part of the difference has actually been financed by private property owners and developers.

This creates two different experiences of the same city.

A higher-income household can live in a privately maintained condominium, travel by car, use private healthcare and education and spend leisure time in professionally managed commercial environments. A lower-income household is generally more exposed to the quality of public roads, buses, pavements, schools, parks and other government or municipal services.

Transport is therefore an important part of Costa Rica’s economic divide.

Greater San José suffers from persistent congestion and a road system that has struggled to keep pace with urban expansion and increasing vehicle ownership. For professionals with private vehicles, flexible working arrangements or the ability to live close to employment centres, congestion is primarily a financial and lifestyle inconvenience.

For workers dependent on buses and multiple connections, transport can determine which jobs are realistically accessible. Long commuting times also reduce the hours available for family life, education and other economic activity.

Costa Rica has begun addressing parts of its long-standing infrastructure backlog through major projects. Planned improvements to the San José-San Ramón corridor, for example, involve investment of around USD 770 million across approximately 55.6 kilometres, including expanded road capacity, new interchanges, bridges and facilities for pedestrians and buses.

The scale of such investment demonstrates both Costa Rica’s ambitions and the extent to which major transport improvements have accumulated over decades.

Roads are only part of the challenge. Water infrastructure, wastewater treatment, drainage, flood protection, bridges, public transport and pedestrian connections all influence where people can live and where businesses and developers are prepared to invest.

For real estate, these differences eventually become reflected in land prices. Well-connected locations with reliable infrastructure, established services and attractive surroundings command higher values. Areas requiring substantial additional investment can struggle to attract development, reinforcing geographical differences within the metropolitan area.

Education has traditionally provided Costa Rica with an important route out of this cycle. Long-term investment in education helped create the skilled workforce that eventually attracted international companies and higher-value industries.

Yet household income can still influence educational opportunity. Wealthier families can access private and international schools, language education, extracurricular activities and overseas study. Maintaining the quality of public education is therefore important not only socially but economically, because it determines whether children from lower-income households can compete for the professional jobs being created by Costa Rica’s increasingly sophisticated economy.

Outside San José, tourism and international residential investment are producing another version of the same economic tension.

Coastal destinations, particularly those attracting North American and other international purchasers, operate partly within a property market supported by foreign incomes. A home that appears reasonably priced to someone earning dollars abroad can be unaffordable to a household dependent on Costa Rican wages.

Foreign investment can provide substantial benefits. It creates construction activity, employment, restaurants, hotels, services and demand for improved infrastructure. But rapidly increasing property values can also make housing more difficult for local workers unless residential supply and local earnings increase alongside international demand.

Costa Rica therefore faces an increasingly important question over how the benefits generated by tourism, multinational investment and international property demand spread into surrounding communities.

There is also an environmental contradiction. Costa Rica has established an exceptional international reputation for conservation, biodiversity and renewable electricity, while its principal metropolitan area remains heavily dependent on cars and congested roads.

Improved public transport, more coordinated urban development and better pedestrian connections could consequently address several problems simultaneously, reducing congestion while improving access to employment and supporting the country’s environmental objectives.

Ultimately, the most important measure of Costa Rica’s economic divide is not the difference between rich and poor households at a particular moment, but the ability of people to move between income groups over their lifetime.

The country retains significant advantages. Political stability, education, healthcare, international investment and an increasingly diversified economy provide a strong foundation for social mobility. Falling poverty also shows that economic progress is reaching part of the population.

Yet substantial informal employment, unequal incomes, expensive housing and uneven infrastructure demonstrate that opportunities remain very different depending on where someone lives, their education and the resources available to their family.

Costa Rica therefore contains several economic realities within a relatively small country.

The modern offices, international retailers and premium residential developments of western Greater San José represent one. Communities where families depend much more heavily on public transport and municipal infrastructure represent another. Coastal markets influenced by tourism and international purchasing power are creating a third.

All are products of the same successful but increasingly complex economy.

For Costa Rica, the challenge ahead is no longer simply attracting investment or generating economic growth. It is ensuring that investment in housing, infrastructure, transportation, education and employment allows a broader share of the population to benefit from that growth.

For the real estate and investment sectors, this makes inequality more than a social question. It influences labour availability, housing demand, land values, development costs, infrastructure requirements and the locations in which future investment can realistically take place.

Costa Rica has demonstrated that a relatively small Central American economy can compete successfully for global investment. The next measure of that success will be how effectively the prosperity visible in its strongest business, residential and tourism markets connects with the communities around them.

Source: © CIJ.World Research & Analysis Team

Mexico’s Economic Transformation Exposes a Growing Divide Between Investment and Everyday Opportunity

Mexico has become one of the most important industrial, manufacturing and consumer economies in the Americas. Its close relationship with the United States, extensive manufacturing base, large domestic market and growing position within international supply chains have created substantial investment and transformed cities across the country. Yet the benefits of this development remain distributed very differently depending on income, employment, education and, perhaps most importantly, geography. The contrast is visible in Mexico City, where some of Latin America’s most expensive residential districts and sophisticated commercial developments coexist with densely populated communities whose residents can spend hours travelling to work. It can also be seen nationally, between industrial cities benefiting from international manufacturing investment and southern states where poverty and limited infrastructure remain much more widespread.

Mexico generated economic output of approximately USD 1.8 trillion in 2025, making it one of the world’s larger economies. With a population exceeding 130 million, however, national averages conceal enormous differences between households and regions. Income inequality has improved gradually, with Mexico’s official statistics recording a Gini coefficient of 0.420 in 2024, compared with 0.431 two years earlier. Household incomes at the bottom of the distribution have also increased substantially over recent years, although the distance between the poorest and wealthiest households remains considerable.

In 2024, households within the lowest tenth of the income distribution received an average of approximately MXN 16,800 (approx. $991) over three months, while those in the highest tenth averaged around MXN 236,000 (approx. $13,918) during the same period. Even this comparison understates the difference between ordinary households and Mexico’s genuinely wealthy population because the highest income category includes both successful professional families and households possessing substantially greater business, property and financial wealth.

Employment provides another important explanation for the divide. Mexico maintains relatively low headline unemployment, but employment does not necessarily mean financial security. More than half of the country’s workers operate under some form of informal employment. During the first quarter of 2026, approximately 32.6 million people were estimated to be working informally, while around 17.6 million worked directly within businesses and activities considered part of the informal sector.

Mexico has engineers, managers, technology specialists, bankers and professionals working for international manufacturers and large domestic companies. These jobs can provide regular salaries, social protection, pensions and access to conventional mortgages. At the same time, millions of people earn their living through small businesses, street commerce, construction, domestic work, agriculture and independent services. Their incomes can be sufficient to support households but may be irregular or difficult to demonstrate to financial institutions. Two workers can therefore both be fully employed while having completely different opportunities to purchase property, obtain credit or accumulate retirement savings.

Education increasingly determines which side of this economy people can enter. International manufacturing, engineering, finance, technology and professional services require increasingly sophisticated skills. English-language ability, technical qualifications and digital knowledge can significantly increase access to better-paid employment. Families able to provide private education, additional language teaching, technology and professional networks consequently give their children advantages extending well beyond current household income.

The geographical divide is even more significant. Northern Mexico and parts of the Bajío have developed powerful industrial economies closely connected with the United States. Monterrey has become one of Latin America’s leading manufacturing and corporate centres, while Tijuana, Ciudad Juárez, Saltillo, Querétaro, Guanajuato and other cities support extensive automotive, electronics, aerospace, logistics and advanced-manufacturing industries. Southern Mexico presents a considerably different picture.

Recent measurements of household earnings show substantial differences between states. At the end of 2024, the proportion of people whose household employment income was insufficient to cover basic food requirements was approximately 13 percent in Baja California Sur and around 20 percent in Nuevo León. In Chiapas it exceeded 60 percent, with Oaxaca and Guerrero recording similarly high levels. A household in an industrial city in northern Mexico may therefore have access to formal manufacturing employment, modern infrastructure and international companies, while a household with similar skills in a remote southern community may face a much smaller employment market and significantly weaker connections to the country’s most productive economic sectors.

Mexico City contains many of these contrasts within a single metropolitan region. Polanco, Lomas de Chapultepec, Bosques de las Lomas, Santa Fe and other affluent areas contain premium housing, international offices, luxury retail, private hospitals and expensive restaurants. Property and consumer markets in these districts can resemble those of substantially wealthier international cities. Yet millions of workers supporting the metropolitan economy live considerably farther from the principal employment centres.

Housing costs may be lower on parts of the metropolitan periphery, but the difference can effectively be paid through travel rather than rent or mortgage payments. Long journeys between home and employment consume time and money and can reduce access to opportunities. A higher-income professional may be able to live closer to work, drive, work partly from home or choose employment according to location. A lower-income worker dependent on public transportation has far fewer alternatives.

Public transport investment can therefore have an economic effect far beyond moving passengers. Mexico City’s cable-car systems provide an example, with new connections developed in densely populated districts including Iztapalapa to improve links between communities located on difficult terrain and the wider metropolitan transport network. Reducing travel time can expand the number of jobs realistically accessible to residents while improving access to schools, healthcare and commercial centres. Transport infrastructure can consequently alter both economic opportunity and property values.

Housing presents another major challenge. Mexico does not simply suffer from insufficient housing. The more difficult problem is providing homes at prices people can afford in locations connected to employment and infrastructure. The federal government is pursuing a major housing programme intended to deliver around 1.8 million new homes during the presidential term, together with a similar number of housing improvement measures and approximately one million property-title actions. By mid-2026, hundreds of thousands of homes were reported to have entered construction or contracting stages.

The scale is significant, but Mexico’s previous experience demonstrates why the location of new housing is as important as the number of units delivered. Large amounts of inexpensive housing have historically been developed on peripheral land where acquisition costs were lower. In some cases, employment, schools, transportation and other infrastructure did not develop at the same speed. A home can therefore be affordable according to its purchase price while becoming expensive in practical terms if residents spend several hours and substantial transport costs reaching work.

Mexico also has a distinctive tradition of households building and improving their homes gradually. Rather than purchasing a completed property from a conventional developer, families may acquire land or an existing structure and expand it over many years as income becomes available. This creates another housing economy alongside the formal developer market. At one end are premium residential developments in Mexico City, Monterrey, Guadalajara and international tourism destinations. In the middle are households purchasing through formal mortgage systems. At the lower end are families progressively constructing or improving their homes, sometimes with limited access to conventional financing.

Property ownership consequently plays an important role in determining long-term wealth. Families who already own property in successful urban markets may have benefited from years of appreciation in land and housing values. Younger households entering those markets must purchase at today’s prices without having accumulated the same assets. Income inequality can therefore decline while differences in accumulated property wealth continue to grow.

Retail demonstrates another side of Mexico’s economic scale. Unlike Costa Rica and Panama, Mexico has an enormous domestic consumer market and substantial manufacturing capacity. More than 130 million consumers provide retailers with distribution volumes unavailable in smaller Central American economies, while domestic production reduces dependence on imports across many categories. Everyday goods can consequently be considerably more affordable than in smaller regional markets.

Premium retail operates according to a different economic logic. Luxury shopping centres and international brands in wealthy areas of Mexico City, Monterrey and major tourism destinations serve a relatively small but financially powerful group of consumers. International visitors and expatriates add further purchasing power in selected locations. Mexico therefore supports both an enormous mass consumer economy and a sophisticated luxury market.

International investment is creating another transformation. The restructuring of North American supply chains has increased interest in manufacturing locations close to the United States. Mexico’s established industrial base, trade relationships and geographical position have made it a major beneficiary of this process. Nearshoring has increased demand for industrial buildings, logistics facilities and development land across northern Mexico and the Bajío.

Factories, however, cannot operate independently of the communities around them. Fast-growing industrial markets require electricity, water, roads, housing, schools and skilled workers. Where these systems fail to expand alongside investment, infrastructure itself can become a constraint on economic growth. This means that the success of Mexico’s industrial property markets increasingly depends on infrastructure outside the boundaries of individual industrial parks.

Water is becoming particularly important. Several of Mexico’s strongest industrial markets are located in regions facing pressure on water resources. Growing cities must accommodate residential demand at the same time as manufacturing facilities require reliable supplies. Water availability is therefore increasingly becoming a real estate and investment consideration rather than simply an environmental issue.

Mexico City faces a different but equally difficult water challenge. The metropolitan region must maintain supply for one of the world’s largest urban populations while dealing with groundwater extraction, ageing networks, drainage requirements and land subsidence. These issues demonstrate how infrastructure can affect households differently.

Higher-income residents can partially protect themselves against weaknesses in public services through private vehicles, private schools, healthcare, security and better-equipped residential developments. Lower-income households are considerably more exposed to the quality of public transportation, roads, schools, healthcare, water and municipal infrastructure. Wealth therefore provides not only greater purchasing power but a greater ability to avoid infrastructure deficiencies.

Tourism produces another version of the divide. Los Cabos, Cancún, the Riviera Maya and other international destinations attract visitors and property buyers whose purchasing power can be substantially greater than local wages. Foreign demand creates hotels, construction employment, restaurants, retail and residential investment, but it can also increase land and housing costs.

This can produce striking contrasts where luxury resorts and expensive second homes exist close to communities occupied by the workers required to operate them. The challenge is ensuring that tourism development generates sufficient housing, infrastructure and economic opportunities for surrounding populations rather than creating isolated pockets of international prosperity.

Mexico nevertheless possesses an advantage unavailable to many smaller tourism-dependent economies: the enormous scale and diversity of its domestic economy. Manufacturing, technology, finance, professional services, retail, agriculture, tourism and entrepreneurship provide multiple potential routes toward higher household incomes. The central challenge is connecting more people with these opportunities.

Infrastructure investment is therefore closely connected with social mobility. Better transportation expands the geographical area in which people can realistically work. Reliable water and electricity allow businesses and housing to develop. Better schools improve access to higher-value employment, while appropriately located housing reduces the economic burden created by long commuting times.

This makes Mexico’s inequality increasingly relevant to the property industry. Industrial developers require workers who can find housing near factories. Office investors require transportation networks connecting employees with business districts. Tourism developers require communities capable of housing hospitality workers. Residential developers depend on mortgage accessibility, while all property sectors require reliable water, electricity and transport infrastructure.

The strongest Mexican property markets are therefore likely to be those where investment and infrastructure develop together. Markets experiencing rapid industrial or tourism expansion without adequate housing, transportation, water or public services risk eventually finding that these shortages constrain further growth.

Mexico’s economic divide should consequently not be understood simply as wealthy households living beside poorer ones. It is simultaneously a geographical, educational, employment, housing and infrastructure divide.

There is the internationally connected Mexico of manufacturing plants, corporate headquarters, technology businesses, luxury property and global tourism. There is the enormous middle and working economy that manufactures goods, operates businesses and supports the country’s cities. There is an informal economy employing tens of millions of people who participate actively in economic life but frequently remain outside conventional financial systems. There are also rural and southern communities where access to the country’s strongest employment markets remains considerably more limited.

Mexico has already demonstrated that it can compete successfully for international manufacturing, tourism and investment. Its next development challenge is ensuring that housing, transportation, education, water and urban infrastructure expand quickly enough to connect a much broader population with the economic opportunities being created.

For real estate investors and developers, this is likely to become one of the defining issues of the Mexican market. Future growth will depend not simply on where international companies want to invest, but on whether the cities receiving that investment can provide the housing, workers, water, transportation and infrastructure required to sustain it.

Mexico’s greatest economic advantage may be its enormous scale. Its greatest challenge is ensuring that the opportunities created by that scale become more accessible across a country where the place someone is born, lives and works can still determine dramatically different economic futures.

Source: © CIJ.World Research & Analysis Team

AI Speeds Up Emissions Analysis, but Data Quality Remains the Missing Link

Artificial intelligence is rapidly changing how investors collect and analyse corporate emissions information, but the technology is exposing rather than eliminating one of the biggest weaknesses in climate reporting: the underlying data is still not consistently comparable.

AI systems can scan thousands of sustainability reports, regulatory filings and corporate documents, identify greenhouse gas figures and convert unstructured disclosures into datasets far faster than conventional analyst teams. This creates significant opportunities for asset managers trying to assess climate exposure across portfolios containing hundreds or thousands of companies.

The challenge begins after the number has been found. A company’s reported emissions depend on decisions about which subsidiaries, operations and assets are included, how organisational boundaries are established, which calculation methods are applied and how purchased electricity is treated. Two businesses can therefore publish apparently comparable Scope 1 or Scope 2 figures that have been constructed on materially different bases.

This remains sufficiently important that the Greenhouse Gas Protocol is undertaking a major overhaul of corporate carbon accounting. In July 2026, it announced that it would work with the International Organization for Standardization to combine their corporate carbon accounting frameworks into a single harmonised global standard. The objective is to improve consistency and confidence in greenhouse gas information used across companies, markets and investment decisions.

The development also reinforces an important qualification to claims about the scale of today’s disclosure problem. While there is substantial professional evidence that emissions reporting suffers from gaps and inconsistencies, the assertion that roughly 40% of disclosed Scope 1 and Scope 2 figures lacked adequate scope or operational boundaries as of February 2026 could not be independently confirmed from a sufficiently authoritative source. That percentage should therefore not be presented as an established market statistic.

The wider issue, however, is well documented. In February, the GHG Protocol was still working through fundamental questions surrounding carbon accounting and said that greater harmonisation was necessary to provide clarity, build confidence and support investment. Its Scope 2 consultation, which closed on January 31, attracted almost 1,400 responses across two related consultations.

One of the clearest examples of the problem involves electricity.

Scope 2 covers indirect emissions associated with purchased electricity, steam, heating and cooling. Companies can report electricity emissions using location-based and market-based approaches. The former reflects the emissions characteristics of the electricity system supplying a location, while the latter incorporates qualifying contractual arrangements associated with the energy a company purchases.

An automated system could therefore find two different Scope 2 figures for the same company without either necessarily being incorrect. The investment question is which figure should be used, under which methodology and for what purpose.

The rules themselves are also changing. Proposed revisions to Scope 2 retain the dual reporting structure but seek greater precision in the emissions factors used for location-based calculations. Proposed changes to market-based accounting include requirements concerning the geographic deliverability of electricity and, in certain circumstances, closer matching between the timing of electricity consumption and clean-energy purchases.

The GHG Protocol has explicitly connected this work with rising expectations for credible, investment-quality climate information, arguing that greater consistency is necessary as emissions data becomes more closely integrated with financial reporting and capital allocation.

For investors, this creates another problem for automated analysis: historical figures are not necessarily fixed.

Companies can recalculate earlier emissions following acquisitions, disposals, changes in organisational structures, improved information or revisions to calculation methodologies. An investment system analysing a five-year emissions trend therefore needs to establish whether the historical figures remain comparable rather than simply extracting a number from each annual report.

This is where the distinction between automated extraction and investment-grade data becomes particularly important.

AI is highly suited to the first stage. It can locate emissions figures, identify reporting periods, classify disclosures and analyse large volumes of documents. It can also highlight missing information or inconsistencies that would take human analysts considerably longer to identify.

Reuters reported in January that AI is already being used across sustainability reporting to analyse unstructured information, identify discrepancies and help fill data gaps. But the same analysis identified risks from inaccurate underlying information, assumptions used in estimates, outdated disclosures and automatically generated reports that appear convincing despite weaknesses in their source material.

Greater automation can therefore magnify mistakes as easily as it can improve efficiency. An incorrectly classified emissions number entering an automated investment system can flow into company comparisons, portfolio carbon calculations, risk models and regulatory reporting before the original error is discovered.

The answer is unlikely to be a return to predominantly manual data collection. Instead, climate-data systems are moving towards a layered approach combining artificial intelligence with structured controls.

AI can perform much of the initial document search and extraction. Rules-based systems can then test reporting periods, units, corporate boundaries and methodologies and identify unexpected changes. Human specialists can concentrate on exceptions, conflicting information and situations where accounting judgement is required.

A further requirement is data lineage. For an institutional investor, a portfolio emissions figure should ideally be traceable backwards through the calculation chain: from portfolio to individual company, from company to emissions metric, from metric to methodology and reporting period, and ultimately back to the original corporate disclosure.

This is increasingly relevant as AI moves deeper into investment research. MSCI argued in July 2026 that speed alone is insufficient for institutional use and that AI-generated investment intelligence needs transparent methodologies, identifiable source data and systematic evaluation if decision-makers are expected to rely on the results.

That principle is particularly important for emissions information because many datasets contain a combination of reported figures, calculated values and estimates. Without clear provenance, an investor may not know whether a portfolio metric ultimately rests on a company disclosure, an external estimate or an assumption introduced to fill missing information.

The evolution of international carbon accounting should eventually improve the situation. The decision by the GHG Protocol and ISO to work towards a single harmonised corporate standard could reduce some of the methodological differences that currently complicate comparisons. But the process is not finished. The GHG Protocol says another consultation on Scope 2 is planned during 2026, with the final revised standard currently expected in 2027.

For investment managers, this means the technology used to process climate information must also be capable of adapting as accounting standards change. A system designed around today’s definitions cannot simply assume that future disclosures will be directly comparable with historical data.

The most reliable model is therefore not AI replacing climate analysts. It is a combination of AI extraction, accounting rules, automated validation, source traceability, exception management and specialist review.

Artificial intelligence can dramatically reduce the amount of manual work involved in finding and organising corporate climate information. It can potentially examine thousands of reports in the time previously required to analyse a fraction of them.

But processing more information does not automatically create better information.

For investors, the critical question is no longer whether AI can find a company’s emissions number. Increasingly, it can do that extremely quickly. The more important question is whether the number has been calculated on a comparable basis, whether its methodology is understood, whether historical figures remain consistent and whether the result can be traced back to a reliable source.

Until corporate carbon accounting becomes substantially more standardised, investment-grade emissions analysis will continue to depend on something more sophisticated than artificial intelligence alone.

Source: CIJ.World Research & Analysis Team

Welcome to Uber Costa Rica: Please Sit in Front and Fold Your Legs Before Entering

Using Uber in Costa Rica can occasionally feel less like ordering a taxi and more like participating in a small theatrical production. You open the app in San José, request a car and watch the little vehicle make its way towards you. Everything appears perfectly normal. The car arrives, you open the rear door, the driver looks at you and says, “Front, please.” And suddenly you are no longer an Uber passenger. You are Carlos’s old university friend who just happens to be travelling across San José with him at precisely the same time that his Uber application is running. Welcome to Costa Rican ride-hailing.

The front-seat request has a genuine explanation. App-based passenger transport has spent years occupying an awkward position within Costa Rica’s transport system. Traditional taxis operate within an established regulatory structure, while Uber and similar platforms developed outside it. For drivers, attracting the attention of traffic authorities can therefore be expensive and inconvenient. This has encouraged a wonderfully simple piece of improvisation: put the passenger in the front.

One person driving with another sitting beside them looks completely ordinary. Two friends going for coffee, a couple heading home, two colleagues discussing spreadsheets, perhaps cousins. Anything, really, except: “Hello officer. Yes, this stranger behind me is paying me to transport him across the city.” Sitting in the back does not prove that somebody is an Uber passenger, of course. Costa Rica has not introduced legislation declaring that friendship legally ends when somebody moves to the rear seat. Nevertheless, some drivers clearly prefer not to advertise what they are doing.

The passenger therefore becomes an unpaid supporting actor. Your role is simple: sit in front, look natural and try not to announce loudly, “THANK YOU FOR ACCEPTING MY UBER COMFORT BOOKING.” It is probably also best not to ask the driver whether he wants five stars while stopped next to a traffic officer.

There is also the long history between ride-hailing drivers and Costa Rica’s famous red taxis. The traditional taxi industry has spent years arguing that app drivers compete for the same customers without operating under equivalent rules. Uber drivers, meanwhile, have continued driving. Passengers have continued ordering them. Politicians have continued discussing what to do about it. And everybody else has apparently got on with their lives. More than a decade after Uber arrived in Costa Rica, the technology belongs firmly to the 21st century while parts of the regulatory argument appear determined to remain somewhere around 2015.

But once you have successfully transformed yourself from paying customer into the driver’s imaginary best friend, another adventure awaits: Uber Comfort. The word “Comfort” creates certain expectations. You might imagine a larger car, more legroom, a generous rear seat and perhaps enough luggage space for two suitcases without requiring an advanced qualification in three-dimensional geometry. Uber itself promotes Comfort as an upgraded option involving newer vehicles and additional passenger space, so naturally you pay the extra money.

Then the app announces that your Uber Comfort has arrived. You look outside. There is a small car. You look at the app. Comfort. You look at the car again. Still small. Perhaps it becomes larger when the doors open. It does not.

You climb inside and discover that “additional legroom” is apparently a philosophical concept rather than a unit of measurement. For an average-sized passenger this might be perfectly acceptable. For a tall passenger, however, the experience can become considerably more intimate. Your knees meet the front seat. The front seat meets your knees. A relationship develops. After twenty minutes together, your kneecaps and the driver’s seatback are practically engaged.

Then there is the luggage. Imagine two travellers arriving with two large suitcases. Nothing extravagant, just the normal luggage carried by people travelling internationally. The boot opens. Everybody looks at the suitcases. Everybody looks at the boot. The boot looks back. This is where Uber Comfort becomes Uber Tetris.

Suitcase one goes sideways. Suitcase two goes diagonally. One bag goes between the passengers and another perhaps occupies the front seat. Unfortunately, the front seat is already required for your performance as the driver’s lifelong friend, so suddenly the logistics become complicated.

The obvious question is whether some drivers are claiming to have larger or higher-category vehicles than they actually possess. That should not automatically be assumed. If the registration plate, vehicle model and other details correspond with those displayed in the Uber app, the driver has probably arrived in exactly the vehicle Uber has approved for that journey. Which produces a much more interesting question: who decided this was Comfort?

Uber’s Costa Rican requirements contain criteria covering vehicle age, doors, equipment, passenger capacity and driver standards. But the publicly available information does not give passengers a beautifully simple promise such as: “Minimum rear legroom: enough for an adult human possessing femurs.” Nor is there a straightforward luggage guarantee saying: “Two passengers plus two large suitcases equals definitely fits.” Instead, a vehicle can satisfy technical requirements while producing a rather different real-world experience.

A car may officially accommodate five people. So does a lift. Nobody describes a crowded lift as premium transportation. This distinction becomes particularly important for tall passengers. Move the driver’s seat backwards and the supposedly generous rear passenger compartment can rapidly disappear.

The problem is therefore not necessarily dishonest drivers. If a completely different car arrives from the one shown in the application, that is different and should be reported. But if the correct car arrives and you need to remove your legs before entering it, the driver has not necessarily cheated you. Uber may simply have a considerably more optimistic definition of comfort than you do.

Luggage capacity has the same problem. Having a boot and having a useful boot are two entirely different achievements. Technically, almost anything has storage space if you are sufficiently determined. A coat pocket has storage space. That does not make it suitable for airport transfers.

This creates a particularly strange contradiction for international travellers in Costa Rica. Many people ordering Comfort are precisely the passengers most likely to need additional room: couples with luggage, business travellers, airport passengers and people taking longer journeys. Yet paying for the more comfortable category does not necessarily guarantee that two large suitcases will disappear elegantly into the boot while everyone climbs aboard. Sometimes the entire exercise resembles moving house using a microwave oven.

None of this means Uber is a bad way to travel in Costa Rica. Quite the opposite. It can be extremely convenient, particularly in San José, and its popularity demonstrates that consumers clearly value it. Visitors may simply need to recalibrate their expectations.

In other countries, ordering Uber can involve three simple stages: order car, enter car, reach destination. In Costa Rica there can occasionally be several additional steps. Order the car, check the registration, open the rear door, watch the driver point towards the front seat, become the driver’s best friend, attempt to enter the vehicle, discover your legs are incompatible with Comfort, rearrange your skeleton, begin negotiations between suitcase and boot, depart, wave casually at a red taxi and look completely natural.

The entire experience provides a surprisingly good illustration of what happens when technology moves faster than regulation. Consumers have already decided that app-based transportation is useful. Drivers have built livelihoods around it. Traditional taxis remain an important part of the transport system. Yet the rules governing how these different models coexist have struggled to reach the same destination.

The passenger sitting in the front seat is perhaps the perfect symbol of the whole situation. Everybody knows why you are in the car. You know. The driver knows. Uber certainly knows. Your credit card knows. Your phone knows. GPS knows exactly where you are going. But for the duration of the journey, you and the driver are simply two old friends taking a completely spontaneous 14-kilometre trip together.

And if you have ordered Uber Comfort, you can enjoy that new friendship while sitting approximately three centimetres from the dashboard. Just remember the three essential rules of Uber Costa Rica: sit in front, look casual and travel with very small suitcases.

Author: Mitzilinka (Turning grim reality into comic relief—without losing the truth)

front page info
LATEST NEWS