


Domestic Investors Reshape India’s Real Estate Capital Market in Record First Half

India’s property investment market is undergoing a significant change in the way projects and acquisitions are being financed, with local investors taking an increasingly prominent role alongside global institutions. The shift coincided with a record first half of 2026, when equity capital flowing into the country’s real estate sector reached approximately USD 8.5 billion.

Investment during the first six months was around 32% higher than the USD 6.4 billion recorded during the same period of 2025. Approximately USD 3.4 billion was deployed during the second quarter alone, demonstrating that investor appetite remained relatively strong despite uncertainty surrounding international trade, geopolitics and financial markets.

More important than the headline volume is where the money came from. Indian capital represented approximately 92% of real estate equity investment during the second quarter, marking a notable change for a property market that has historically depended heavily on overseas private equity, sovereign funds and international institutional investors for major transactions.

Developers were particularly active, accounting for roughly one-third of investment during the quarter, while Indian institutional investors contributed a similar proportion. This suggests that the country’s property market is developing a deeper pool of domestic capital capable of financing development and acquisitions without relying as heavily on international investors.

The assets attracting this money also provide an indication of investor priorities. Land and development opportunities, together with completed office properties, accounted for approximately 94% of second-quarter equity deployment. Investors are therefore pursuing opportunities at both ends of the property cycle: securing sites for future development while acquiring established commercial assets capable of producing immediate income.

Separate institutional investment figures also point towards strengthening domestic participation. Around USD 4.5 billion was invested by institutional players during the first half of 2026 under a narrower measurement of the investment market, approximately 50% more than a year earlier. Indian investors accounted for around USD 2.6 billion of this amount, with their deployment increasing by roughly 80% year-on-year.

Offices remained one of the strongest destinations for institutional money, attracting approximately USD 1.9 billion during the first six months. The sector continues to benefit from healthy occupier demand, particularly from Global Capability Centres and flexible workspace providers. Office leasing reached approximately 45.5 million sq ft during the period, accompanied by around 32 million sq ft of new completions.

Capital is nevertheless beginning to spread into a wider selection of property types. Mixed-use developments, hotels, data centres and other emerging sectors are becoming increasingly relevant as investors seek exposure to structural changes in India’s economy rather than relying solely on traditional office and residential strategies.

Mixed-use properties attracted around USD 800 million of institutional investment during the first half, while a similar amount was directed towards alternative assets. Hospitality investment reached approximately USD 300 million, more than three times the level recorded during the corresponding period of 2025, although the increase came from a comparatively low starting point.

Geographically, India’s three largest investment centres continue to dominate. Bengaluru, Delhi-NCR and Mumbai collectively accounted for approximately 60% of equity capital entering the property market during the second quarter. Their combination of corporate demand, development opportunities, established infrastructure and mature transaction markets continues to make them the preferred locations for large-scale investment.

However, the investment landscape is gradually widening. Capital is increasingly considering opportunities outside the largest metropolitan markets, particularly where expanding manufacturing, logistics, tourism and residential demand are creating new institutional-grade property opportunities.

The significance of India’s record first half therefore extends beyond the USD 8.5 billion invested. The composition of that capital indicates that the country’s real estate market is developing a stronger domestic financial ecosystem capable of supporting increasingly large transactions.

International capital will remain an important part of India’s property market, particularly for major platforms, portfolio transactions and specialised sectors. But its role is becoming part of a broader funding environment that now includes stronger domestic institutions, developers, listed REITs and alternative investment structures.

That evolution could make India’s investment market more resilient during periods when international capital becomes cautious. A deeper domestic investor base provides another source of liquidity and reduces the market’s dependence on global fundraising cycles.

If investment maintains its momentum during the remainder of the year, 2026 could become a landmark period for Indian real estate. The more important development, however, may be structural rather than numerical: India is increasingly generating the capital required to finance the next stage of its own property market growth.

Source: © CIJ.World India Research & Analysis Team

Cybersecurity Anxiety Deepens in Poland as Personal Data Exposure Grows

Concern over the security of personal information is becoming increasingly widespread in Poland, with new research showing that almost four in five people fear that compromised data could eventually lead to financial losses.

A 2026 study commissioned by the Credit Information Bureau, BIK, found that 79% of respondents were worried about the financial consequences that could follow a personal-data breach. More than one third, 37%, indicated a particularly high level of concern.

The findings point to a gradual change in how Polish consumers perceive cybercrime. Online fraud and identity theft are increasingly being regarded as risks that can affect ordinary households rather than isolated problems experienced by companies or particularly vulnerable internet users.

Personal experience of data-security incidents is also increasing. Around 33% of respondents said that either they or somebody close to them had encountered a situation involving compromised personal information. In 2022, the corresponding figure stood at 24%.

Direct exposure has also become significant, with 15% of people questioned in the latest study saying their own information had been involved in such an incident.

The results arrive against the backdrop of a major cybersecurity case affecting Poland’s healthcare sector. An incident involving technology provider MyDr has raised concerns over information relating to a very large number of patients and medical organisations.

Authorities have indicated that historical information associated with as many as approximately 18.8 million people could potentially have been exposed, together with data connected with more than 12,000 healthcare organisations. The precise number of individuals ultimately affected remains subject to investigation.

The scale of the case demonstrates how rapidly the consequences of a security failure can spread through an increasingly interconnected economy. A breach involving a technology supplier can potentially affect thousands of organisations using the same platform, even when those organisations’ own internal systems have not been directly attacked.

This creates an increasingly complicated risk environment for businesses. Companies routinely rely on external providers for cloud storage, customer management, payments, communications and specialist software. As these relationships multiply, protecting information increasingly depends not only on an organisation’s own cybersecurity standards but also on those maintained throughout its network of suppliers.

The same challenge is becoming relevant to the commercial property industry. Modern buildings increasingly depend on interconnected technology for access management, security, parking, visitor registration, energy monitoring, tenant services and building operations.

Office owners, shopping-centre operators, logistics developers, hotel groups and residential platforms can consequently hold or process substantial amounts of information about employees, tenants, customers, contractors and visitors. The expansion of digital building services therefore creates operational efficiencies while simultaneously increasing the number of systems that require protection.

The consequences of compromised information can also extend considerably beyond the original incident. Unlike a physical asset, personal information cannot simply be recovered and made unusable once an unauthorised party has obtained a copy.

Names, telephone numbers, addresses and other identifying information can subsequently be combined with information obtained from other sources. This can make fraudulent telephone calls, messages and emails appear considerably more credible because the person attempting the fraud already possesses genuine details about the intended victim.

That makes social manipulation an increasingly important component of cybercrime. Rather than attempting to obtain everything through a single technical attack, criminals can use previously compromised information to persuade individuals to reveal additional details or authorise transactions themselves.

For consumers, this means greater caution is required when receiving unexpected communications requesting information or financial action. Monitoring activity connected with an individual’s identity and credit history can also provide an indication that personal information is being used without permission.

For companies, however, the challenge is considerably broader. A serious security incident can generate regulatory investigations, legal costs, operational disruption and reputational damage while undermining confidence among customers and business partners.

The economic consequences can therefore continue long after the technical vulnerability responsible for the original incident has been repaired.

Poland’s growing public concern suggests that cybersecurity performance may increasingly influence consumer trust in businesses. Organisations collecting personal information are likely to face greater expectations to demonstrate not only that their own systems are appropriately protected, but that external technology providers handling the same information meet comparable standards.

The issue is particularly important as digitalisation spreads into industries that historically regarded cybersecurity primarily as a technology-sector concern. Healthcare, banking and telecommunications already manage large volumes of sensitive information, but property, retail, hospitality and logistics businesses are also becoming increasingly data dependent.

Buildings themselves are evolving into digital platforms. Access systems recognise employees and visitors, parking applications record movements, residential platforms manage tenant information and smart-building technology continuously exchanges operational data.

That evolution makes cybersecurity part of the wider discussion surrounding the resilience and management of real estate assets.

The latest Polish survey indicates that public awareness is moving in the same direction. With 79% of respondents now concerned about the possible financial consequences of compromised information and one third already having some direct or indirect experience of a data breach, confidence in the protection of personal information can no longer be taken for granted.

As businesses accumulate more information and become increasingly dependent on external technology providers, cybersecurity is moving beyond the boundaries of IT departments. It is becoming an issue of corporate governance, operational resilience and customer confidence, and one that companies across Poland’s increasingly digital economy will find progressively harder to ignore.

Eurocash Reshapes Its Property Footprint as Polish Grocery Competition Intensifies

Eurocash is moving into a new stage of its transformation after spending much of 2026 reducing the physical footprint of its retail, wholesale and logistics operations. With most of the planned closures now completed, the Polish food distribution group is preparing to turn its attention back towards sales growth and maintaining its position in an increasingly competitive grocery market.

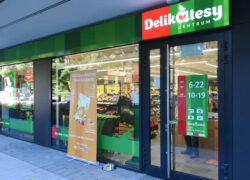
The changes underway across the business have significant implications for commercial property. Eurocash has been closing underperforming Delikatesy Centrum stores, reducing the number of Cash & Carry facilities, consolidating distribution operations and transferring directly managed shops to independent franchise operators. Together, these measures are changing the group’s requirements for retail, warehouse and administrative space across Poland.

By the end of the first half of 2026, Eurocash had closed 105 of the 144 Delikatesy Centrum locations selected for closure. The company has also been reducing the number of stores it operates directly. By the end of July, 73 locations had moved to franchise operators as part of a programme covering 188 stores, with further transfers expected through the beginning of 2027.

The wholesale property portfolio has been undergoing a similar adjustment. Fourteen of the 16 Cash & Carry locations scheduled to cease operations had already been closed, while the group’s distribution infrastructure has been consolidated from 15 centres to 10. Changes have also taken place within the corporate structure, where previously separate administrative and operational functions are being brought together.

For the property market, the consequences extend beyond the number of businesses being closed. Former grocery stores and wholesale facilities can return to landlords or become available for alternative occupiers, while locations converted to franchise operation may continue trading with relatively little visible change from a consumer perspective.

This distinction could become increasingly important for retail landlords. Moving a shop from direct Eurocash management to an independent entrepreneur does not necessarily remove the Delikatesy Centrum brand from the property. Instead, responsibility for operating the business shifts towards the franchise partner, potentially changing the contractual relationship surrounding the premises.

Eurocash has not published the combined floor area affected by the restructuring or detailed how many of the properties involved are owned rather than leased. It has also not provided a comprehensive breakdown of leases that have been cancelled, transferred or renegotiated. Consequently, the amount of space ultimately returning to the Polish commercial property market remains unclear.

Nevertheless, the geographical reach of the programme means its impact is likely to be dispersed across numerous local markets rather than concentrated in a handful of major cities. Grocery properties are often positioned within established residential districts and smaller regional centres, where suitable food-retail locations can remain attractive even when an individual operator decides that a store no longer fits its business model.

Some former Eurocash locations could therefore find new occupiers relatively quickly. Existing grocery infrastructure, established customer catchments and convenient neighbourhood locations may make them suitable for competing supermarket, discount or convenience operators. Other properties, particularly larger wholesale facilities, could require more extensive repositioning depending on their location, configuration and ownership structure.

The transformation is being driven by Eurocash’s attempt to reduce operating costs while preserving the scale of the commercial network supplied by the group. Increasing the proportion of franchise-operated stores allows the company to maintain relationships with retailers and continue supplying merchandise without carrying the full operating burden associated with running each individual shop.

Property expenses have been one element of that equation. A considerable part of the directly operated Delikatesy Centrum estate originated from earlier acquisitions, including the EKO and Mila businesses. Since those transactions, higher operating expenses, changing consumer behaviour and increasingly aggressive competition have altered the economics of many individual locations.

Eurocash is assessing stores according to their ability to operate sustainably under current market conditions. Locations considered viable under independent management can move into the franchise system, while weaker stores are being removed from the network.

The financial objective behind the programme is substantial. Eurocash had secured PLN 279 million of its targeted PLN 400 million in recurring annual savings by the middle of 2026. Changes to the directly operated Delikatesy Centrum portfolio are expected to make an important contribution to the improvement visible in the group’s 2027 performance.

The restructuring has also weighed on turnover. Eurocash generated approximately PLN 7.2 billion of sales during the second quarter, representing a decline of close to 9% compared with the corresponding period of 2025. Part of the reduction resulted from difficult conditions within Poland’s traditional grocery sector, while deliberate store closures and other restructuring measures also reduced revenue.

Management is now signalling that the emphasis is beginning to change. Rather than continuing to focus primarily on reducing expenditure, the second half of 2026 is expected to place greater importance on strengthening sales. Eurocash wants to preserve its share of the Polish FMCG market during 2027, meaning future performance will increasingly depend on growing with the wider market.

The franchise network will be central to that strategy. While Poland’s traditional grocery channel has been contracting, stores operating within networks supplied by Eurocash have performed comparatively better. Hundreds of additional stores joined networks cooperating with the group during the first half of the year, strengthening the company’s reach even as it reduced the number of locations under direct management.

This creates an unusual property dynamic. Eurocash can shrink its own directly controlled real estate requirements while maintaining or potentially expanding the number of shops connected to its distribution system. In effect, part of the property risk moves towards independent retailers while Eurocash concentrates on wholesale supply, purchasing power, logistics, technology and franchise support.

The strategy is unfolding at a particularly important moment for Poland’s grocery sector. Canadian convenience group Alimentation Couche-Tard is pursuing the acquisition of Żabka Group in a transaction valuing the Polish convenience-store operator at approximately PLN 32.6 billion. The tender process formally opened on 26 August 2026.

Żabka has developed one of Europe’s densest convenience networks, with approximately 13,000 stores across Poland and Romania. The proposed transaction would place that platform under the control of a major international convenience retailer and could provide additional financial and operational resources for further development.

For Poland’s commercial property market, this adds another dimension to the competition for neighbourhood locations. Convenience stores, supermarkets, discount operators and independent grocery businesses frequently compete for similar residential catchments, particularly in rapidly developing urban districts and commuter markets.

The contrast between the two strategies is notable. Eurocash is reducing direct responsibility for individual stores and relying more heavily on independent entrepreneurs, while Żabka could become part of a much larger international retail organisation. Both models nevertheless depend on securing extensive networks of well-positioned physical locations.

The next stage of Eurocash’s transformation will therefore be important for landlords as well as investors in the company. Properties released through closures could provide opportunities for competing retailers, while successful franchise conversions may allow Delikatesy Centrum stores to remain in existing premises under a different operating structure.

The larger question is whether Eurocash can reduce its direct property exposure without weakening the scale of the retail ecosystem it supplies. If the company succeeds, its restructuring could demonstrate how a large grocery group can retain market reach while shifting a greater share of store-level costs and property responsibilities towards franchise operators.

As the closure programme approaches completion, Eurocash is moving from contraction towards consolidation and renewed growth. At the same time, international capital is preparing to play a larger role in Poland’s convenience sector. Together, these developments suggest that the country’s next phase of grocery competition will not simply be about opening more stores, but about who controls the locations, who carries the property risk and which operating model can generate the strongest returns from Poland’s extensive neighbourhood retail network.

Source: CIJ.World Research & Analysis Team
Photo: Delikatesy Centrum – Eurocash

EU Goods Trade Moves into Deficit as Import Growth Accelerates

The European Union’s trade in goods with the rest of the world expanded during the second quarter of 2026, but imports grew considerably faster than exports, resulting in a quarterly trade deficit and highlighting the continued importance of China and the United States to European supply chains.

EU countries imported €701.8 billion of goods from outside the bloc during Q2 2026, while exports reached €680.0 billion. Compared with the first quarter, imports increased by 9.9% and exports by 5.4%. The difference was also pronounced on an annual basis, with imports rising 11.7% compared with Q2 2025 while exports increased by 4.5%.

Based on the reported values, the EU recorded a goods trade deficit of approximately €21.8 billion with non-EU countries during the quarter. The figures indicate that the expansion in international merchandise flows was increasingly weighted towards products entering the European market.

China remained by far the EU’s largest external source of goods. European imports from China reached €153.6 billion, equivalent to 21.9% of all goods purchased from outside the EU. Imports from China increased by 7.9% compared with the corresponding quarter of 2025.

The United States was the EU’s second-largest supplier, accounting for €98.7 billion, or 14.1% of imports. Purchases from the US increased by 11.5% year-on-year. The United Kingdom supplied €43.4 billion, Switzerland €36.9 billion and Türkiye €25.5 billion.

The geographical pattern looked substantially different on the export side. The United States remained the largest individual destination for EU goods, receiving €127.7 billion, equivalent to 18.8% of extra-EU exports. The UK followed with €92.7 billion, ahead of Switzerland at €60.5 billion, China at €50.3 billion and Türkiye at €27.3 billion.

The direction of EU-US trade changed noticeably compared with a year earlier. While imports from the United States increased by 11.5%, European exports to the US declined by 5.6%. Based on the quarterly values, the EU nevertheless retained a goods surplus of around €29 billion with the United States.

China presents a very different trading relationship. EU imports from China were more than three times the value of exports moving in the opposite direction. Based on the figures for the quarter, this produced an implied EU goods deficit with China of approximately €103.3 billion. European exports to China increased by 2.8% year-on-year but remained far below the value of incoming goods.

Switzerland recorded some of the strongest growth among the EU’s major export markets. European exports to the country increased by 16.1% compared with Q2 2025, reaching €60.5 billion. Exports to the UK rose by 5.6%, while shipments to Türkiye declined by 4.9%.

For Europe’s industrial and logistics property markets, the acceleration in imports is significant because international merchandise ultimately feeds into a network of ports, airports, rail terminals, warehouses and distribution centres. Higher trade values do not automatically translate into equivalent increases in physical freight volumes, but the figures nevertheless point to substantial activity moving through European supply chains.

The concentration of trade among a relatively small number of major partners also reinforces the strategic importance of Europe’s principal logistics gateways. Goods arriving from Asia and North America are distributed through major maritime ports and inland transport corridors before reaching manufacturing facilities, fulfilment centres, retailers and consumers across the continent.

At the same time, the growing difference between import and export performance raises a broader question for European industry. Strong imports can reflect resilient domestic consumption and demand for components and capital goods, but a sustained pattern in which imports expand significantly faster than exports could also increase concerns about the competitiveness of European manufacturing.

The US figures deserve particular attention in this respect. The country remains Europe’s most important external market for goods, but the combination of falling EU exports and sharply higher imports means the trade relationship became less favourable to the EU during the second quarter.

For commercial real estate, the immediate picture is more mixed. Expanding international trade should continue to support Europe’s logistics infrastructure, particularly around ports and major distribution corridors. However, the longer-term implications will depend on whether stronger imports are accompanied by investment and industrial growth within Europe or increasingly substitute domestically produced goods.

The Q2 figures therefore show an EU trading economy that remains deeply integrated with global markets but is becoming more import-heavy. With €701.8 billion of goods entering the bloc in just three months, the resulting flows continue to underpin demand for logistics infrastructure, while the €21.8 billion overall trade deficit raises a wider question about Europe’s ability to translate international demand into stronger export and manufacturing growth.

BIG Expands Warsaw-Area Retail Footprint with Grodzisk Mazowiecki Rebranding

BIG Poland has completed the rebranding of a recently acquired retail park in Grodzisk Mazowiecki, extending its presence in the Warsaw metropolitan area as the investor continues to expand its Polish portfolio.

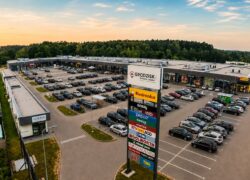
The former Grodzisk Sfera Park is now operating as BIG Grodzisk Mazowiecki following its acquisition by BIG Poland only weeks ago. The property becomes the company’s second retail park in the Mazowieckie voivodeship after BIG Łubna and gives the group a presence in the western part of the Warsaw metropolitan area.

The retail park provides approximately 11,000 sqm of gross lettable area and contains 19 shops and service units. The scheme is fully occupied, with tenants including Biedronka, Sinsay, New Yorker, JYSK, RTV Euro AGD, Rossmann, Pepco, Dealz, KiK, TEDi, Martes Sport, Maxi Zoo, Woolworth, Świat Książki and Kodano Optyk, alongside food and beverage operators.

Rather than representing additional retail development, the Grodzisk transaction illustrates BIG’s use of acquisitions to increase its Polish presence and bring established properties into its operating platform. The rebranding gives the existing scheme a new identity while allowing the investor to apply its own asset-management strategy to an already trading and fully leased property.

“Opening BIG Grodzisk Mazowiecki is another important step in strengthening our presence in the Mazowieckie voivodeship and the wider Warsaw metropolitan area,” said Eran Levy, CEO of BIG Poland. He described Grodzisk Mazowiecki as a growing market with long-term potential and said the company intends to develop further activities aimed at connecting the property with its local catchment.

BIG will formally introduce the rebranded property to customers on 29 August with a public event running between 14:00 and 20:00. The programme includes family entertainment, children’s activities, live performances and food, with admission to the attractions free of charge.

The location provides a strategic element to the acquisition. Grodzisk Mazowiecki is approximately 30 km from central Warsaw, while the retail park is positioned close to the town centre and has connections to the city ring road, A2 motorway and DK50 national road. The property provides 350 parking spaces.

According to BIG, the scheme serves more than 100,000 residents across Grodzisk Mazowiecki, the surrounding county and neighbouring municipalities. This combination of a growing suburban market, road accessibility and an established tenant base gives the property characteristics increasingly sought in Poland’s retail-park investment market.

The acquisition also fits into a much broader expansion of BIG’s Polish platform. The company has been operating in Poland since 2022 and now owns 13 retail parks with combined GLA approaching 258,000 sqm. Its portfolio extends across markets including Gorzów Wielkopolski, Olsztyn, Koszalin, Kielce, Włocławek, Lubin, Suwałki and Ostróda, as well as its two properties in Mazowieckie.

Further growth is planned through developments in Piła, Olkusz, Konstantynów Łódzki and Bolesławiec, giving BIG a combination of acquired operating properties and new projects through which to increase its exposure to the Polish retail market.

The Grodzisk Mazowiecki rebranding therefore represents more than a change of name. It shows how retail-park investors can expand through the acquisition of established, income-producing properties and subsequently integrate them into larger operating platforms.

For Poland’s retail property market, this approach is becoming an important complement to new development. Fully occupied schemes serving growing regional and metropolitan catchments can provide investors with immediate income while still offering opportunities for active management, repositioning and longer-term value creation.

European Aviation Nears Full Recovery as EU Flight Traffic Reaches 6.9 Million

Commercial aviation across the European Union moved close to its pre-pandemic level in 2025, with the number of flights continuing to increase as demand strengthened across the continent’s major airports.

EU airports recorded 6.9 million commercial flights during 2025, an increase of 3.8% compared with the 6.7 million registered a year earlier, according to Eurostat data based on information from Eurocontrol. Flight activity has increased each year since 2021 and is now close to the 7.0 million movements recorded in 2019 before the pandemic disrupted international travel.

The figures cover scheduled and non-scheduled commercial services carrying passengers, freight and mail under Instrument Flight Rules. They measure aircraft movements rather than passenger numbers and therefore provide a picture of aviation activity rather than the number of people travelling through European airports.

Scheduled services continued to dominate the market, although charter and other non-scheduled commercial operations accounted for 8.5% of total flights during 2025. Their importance increased considerably during the summer holiday season.

June recorded 648,707 commercial flights, rising to 690,855 in July and reaching 693,046 in August. Non-scheduled services represented 11.2% of June flights, 12.3% in July and 11.4% in August, reflecting the seasonal importance of leisure and charter travel.

Europe’s largest aviation hubs continued to account for substantial volumes of activity. Amsterdam Schiphol was the EU’s busiest airport measured by commercial flight movements in 2025, with approximately 488,000 flights. Paris Charles de Gaulle followed with around 476,000, while Frankfurt/Main recorded approximately 457,000.

The ranking reinforces the importance of the major north-western European hubs to the continent’s aviation network. Their return towards pre-pandemic traffic levels also increases the focus on whether existing airport infrastructure can accommodate future growth efficiently.

Among the EU’s ten airports with the largest number of commercial movements, Athens International Airport had the highest proportion of non-scheduled services at 5.2%. Madrid-Barajas followed at 4.8%, while Copenhagen Airport recorded 4.1%.

For the commercial property and infrastructure sectors, the recovery in aviation has consequences extending well beyond airport terminals. High and sustained flight volumes support demand for hotels, retail, food and beverage space, car parking, ground transportation and other passenger-related services surrounding major airports.

Cargo and logistics property can also benefit from stronger aviation networks, although total commercial flight numbers should not be interpreted as a direct measure of air-freight demand. Individual airports differ substantially in their exposure to passenger services, cargo operations and connecting traffic.

The return towards 2019 flight volumes also changes the investment discussion surrounding European airports. During the immediate post-pandemic period, operators were primarily concerned with restoring routes and rebuilding passenger demand. With aircraft movements now approaching their previous scale, attention is increasingly shifting towards capacity, modernisation and the quality of infrastructure serving airports.

That could increase pressure for investment in terminals, rail and public transport connections, energy systems and surrounding commercial developments, particularly at airports where capacity constraints existed before the pandemic.

Further aviation growth will nevertheless have to be balanced against environmental restrictions, noise considerations and national policies governing airport expansion. Some of Europe’s largest airports operate within densely populated metropolitan regions, making significant physical expansion considerably more complicated than simply responding to rising traffic with additional capacity.

The 2025 figures therefore mark an important stage in European aviation’s recovery. With 6.9 million commercial flights putting the EU within roughly 1% of its 2019 total, the industry’s central challenge is increasingly shifting from rebuilding traffic towards determining how existing infrastructure can accommodate future demand while managing capacity and environmental constraints.

Poland Sets Out PLN 978 Billion Budget with Infrastructure, Energy and Defence at the Core

Poland is preparing another year of substantial public spending in 2027, with the government directing significant resources towards defence, transport infrastructure, energy security, healthcare and housing while forecasting continued economic growth.

Under the draft budget adopted by the government, state expenditure is planned at PLN 977.6 billion, against revenues of PLN 695 billion. This would leave a maximum state-budget deficit of PLN 282.6 billion, illustrating the fiscal cost of maintaining extensive investment and social programmes while increasing security expenditure.

Defence remains one of the largest priorities. Combined resources from the budget and the Armed Forces Support Fund are expected to reach PLN 198.1 billion, equivalent to 4.51% of projected GDP. Further expenditure of PLN 36.5 billion is planned for the police, Border Guard, fire services, State Protection Service and security agencies.

The scale of defence expenditure increasingly overlaps with Poland’s infrastructure strategy. Transport links, ports and energy facilities are being developed not only to increase economic capacity but also to strengthen the country’s ability to move military personnel and equipment and maintain essential services.

Road and railway programmes alone are expected to receive PLN 62.4 billion in 2027, excluding expenditure associated with the Central Transport Port. Of this amount, PLN 26.4 billion is expected to come directly from the state budget.

Around PLN 16.4 billion is planned for the national road development programme, while PLN 1.7 billion is allocated to the programme delivering 100 bypasses. Among the strategically important projects is the new DK7 connection known as the Red Road, intended to improve access to the Port of Gdynia. The project is currently estimated at approximately PLN 4.5 billion and is regarded as important both for freight movements and military mobility.

Railway investment will include restoring connections to locations that have been without passenger rail services for years, including Olecko, Bytów, Nowy Dwór Gdański and Limanowa. The government is also planning infrastructure improvements allowing trains to operate at up to 250 km/h on routes connecting Warsaw with Kraków, Katowice and Wrocław.

Poland’s maritime infrastructure programme provides another source of construction activity. Approximately PLN 2.4 billion of state expenditure is planned for the maritime economy, including PLN 1.2 billion associated with multi-year programmes.

Projects include infrastructure serving the FSRU terminal being developed in the Gulf of Gdańsk, a marine facility supporting construction of Poland’s first nuclear power station and improvements to maritime access around Świnoujście and Szczecin. The FSRU project is expected to provide capacity equivalent to around 30% of Poland’s annual gas requirements.

Energy investment is another significant component of the programme. The government plans expenditure of PLN 19.7 billion on energy security and transformation, around PLN 1.5 billion more than in 2026.

Within this allocation, PLN 8 billion has been reserved for capital connected with development of Poland’s first nuclear power plant. Other projects identified by the government include the 1.5 GW Baltica 2 offshore wind development, new gas-fired generating capacity in Rybnik and a lithium-ion energy storage facility at Żarnowiec.

The combination of nuclear, offshore wind, conventional generation, storage and grid-related infrastructure points towards a substantial long-term construction pipeline. It also has implications for industrial and logistics property because access to reliable electricity capacity is becoming increasingly important for manufacturers, data centres and other energy-intensive occupiers.

Housing receives a considerably smaller but still significant allocation. The government plans PLN 5.8 billion of housing expenditure in 2027, with funding intended to support municipal and social housing construction and renovation. Student accommodation will also form part of the programme through investment in new and refurbished dormitories.

The spending plans extend into industrial policy. Around PLN 3.6 billion is earmarked for measures supporting energy-intensive Polish industries, while more than PLN 1 billion is planned for development of the country’s space sector.

Science and higher education expenditure is expected to reach PLN 46.2 billion, an increase of more than PLN 2.6 billion from 2026. The programme includes university funding as well as research infrastructure, artificial intelligence computing capacity, supercomputing and cybersecurity investment.

Healthcare represents another major spending commitment. Total expenditure is projected at PLN 274.1 billion, PLN 26.3 billion more than in 2026. This includes PLN 41.5 billion in funding for the National Health Fund, an increase of PLN 15.5 billion.

Large social programmes will continue alongside the investment agenda. The Family 800+ programme is allocated PLN 60.8 billion, Active Parent PLN 7 billion and support benefits for people with disabilities PLN 12.6 billion. Another PLN 32.1 billion is planned for the additional 13th and 14th pension payments.

The budget is based on the assumption that Poland’s economy will expand by 3.0% in 2027, with average annual inflation of 2.8% and average wages increasing by 5.9%. The government expects unemployment to remain broadly unchanged.

Revenue is forecast to increase to PLN 695 billion, around 7.8% above the amount contained in the 2026 Budget Act. Tax receipts are expected to reach PLN 622.4 billion, supported by economic growth as well as changes to taxation and collection.

VAT revenue is projected at PLN 363.7 billion, while CIT receipts are forecast at PLN 94.6 billion. The government is also proposing changes affecting some of Poland’s largest companies, including an increase in the basic CIT rate from 19% to 22% for taxpayers with annual revenues above €50 million, excluding banks already covered by a separate higher rate.

For the property and construction sectors, the significance of the 2027 budget lies in the breadth of capital programmes rather than any single allocation. Roads, railways, ports, nuclear power, offshore energy, housing and strategic industrial infrastructure together create a sizeable pipeline extending across numerous regions and property sectors.

The fiscal position provides the counterbalance. Planned expenditure exceeds state-budget revenue by more than PLN 280 billion, while Poland remains subject to European fiscal constraints. The government will therefore be attempting to sustain an ambitious investment programme while simultaneously financing defence, healthcare and extensive household support.

The 2027 plan consequently illustrates how Poland’s development strategy is increasingly linking economic infrastructure with national security. Transport corridors, ports and energy projects that improve the country’s commercial competitiveness can simultaneously strengthen military mobility and energy independence, potentially making strategic infrastructure one of the most important sources of Polish construction and investment activity in the coming years.

Czech Economy Gains Support from Investment as Q2 Growth Reaches 1.9%

The Czech economy continued to expand during the second quarter of 2026, with stronger investment and household spending providing much of the momentum while construction, industry and real estate activities all contributed to the broader improvement.

Gross domestic product increased by 0.4% compared with the first quarter and by 1.9% year-on-year, according to the refined estimate published by the Czech Statistical Office on 28 August. The figures confirm continued economic growth, although the underlying components show considerable differences in performance.

Investment emerged as one of the strongest drivers. Gross fixed capital formation increased 1.5% quarter-on-quarter and 7.1% compared with Q2 2025. Spending on residential property, other buildings and structures, and transport equipment was among the areas contributing to the annual increase.

Fixed investment added an estimated 1.7 percentage points to annual GDP growth, making it a larger positive contributor than household consumption. For the property and construction sectors, this is particularly significant because the improvement is being accompanied by increased spending on physical assets rather than being driven exclusively by consumption or exports.

Construction also recorded modest growth during the quarter. Gross value added in the sector increased 0.3% from Q1, while real estate activities expanded by 0.6%. Industry performed more strongly, recording quarterly growth of 0.9%.

Industrial activity also contributed to the annual expansion. Industry increased 1.8% compared with Q2 2025, while trade, transport, accommodation and food services grew 2.4%. Information and communication recorded an annual increase of 4.1%.

Consumer demand provided another important source of growth. Household expenditure increased 0.5% quarter-on-quarter and 2.7% year-on-year, while government consumption was 0.1% higher than in Q1 and 1% above its level a year earlier. Overall final consumption increased 2.2% annually.

The improvement in household expenditure is relevant to the commercial property market because stronger consumption can provide a more supportive environment for retailers, shopping centres, retail parks, hospitality operators and other consumer-facing businesses. Household consumption contributed approximately 1.1 percentage points to annual GDP growth.

Foreign trade also remained supportive, although imports grew slightly faster than exports on an annual basis. Export volumes increased 0.9% from the previous quarter and 3.3% year-on-year, helped by motor vehicles, electronics and electrical equipment. Imports were unchanged quarter-on-quarter but increased 3.7% compared with Q2 2025.

The trade surplus in goods and services amounted to CZK 99 billion at current prices, although this was CZK 20.5 billion lower than a year earlier.

One of the main constraints on headline growth came from inventories. Changes in stocks reduced annual GDP growth by approximately 1.3 percentage points, offsetting part of the positive contribution from investment, household expenditure and trade. Inventories increased by CZK 17.6 billion during the quarter at current prices, but that was CZK 17.9 billion less than in the corresponding period of 2025.

Employment data also point to continued economic activity. Total employment increased 0.9% from the previous quarter and 1.5% year-on-year, while the total number of hours worked rose 0.7% quarterly and 2.8% annually. Labour costs increased 7.1% compared with the second quarter of last year.

Price pressures have not disappeared. The GDP deflator, a broad measure of price changes across the economy, increased 1% quarter-on-quarter and 2.6% year-on-year.

For the Czech property industry, the composition of Q2 growth is arguably more significant than the headline GDP figure. A 1.9% annual expansion remains moderate, but investment is growing substantially faster than the economy overall, with buildings and residential property among the areas contributing to the increase.

The simultaneous expansion of industry, construction and real estate activities also provides a more supportive backdrop for commercial property than an economic recovery concentrated in only one sector.

The figures nevertheless point to a gradual rather than dramatic Czech recovery. Inventory movements remain a sizeable drag, the nominal trade surplus has narrowed and labour costs continue to rise considerably faster than overall economic output.

The stronger investment numbers are therefore the most important signal for the property market. If the 7.1% annual increase in fixed investment proves sustainable, the Czech recovery could increasingly translate into demand for development, infrastructure and productive real estate rather than remaining primarily a statistical improvement in headline GDP.

Poland’s Labour Market Loses Momentum as Employers Turn More Cautious

Poland’s labour market remains relatively stable, but forward-looking indicators are beginning to point towards weaker conditions as businesses become more cautious about recruitment and the number of people losing jobs for employer-related reasons increases.

Registered unemployment remained at 5.8%, unchanged from the previous month. However, the Labour Market Indicator compiled by BIEC, which is intended to anticipate changes in unemployment, increased by 0.3 points in August. This was its second consecutive monthly increase and left the indicator 0.8 points above its level at the end of 2025.

The figures do not yet indicate a significant deterioration in employment. Instead, they suggest that the period in which Poland could rely on steadily declining unemployment may be coming to an end. The longer-term chart included in the August report also shows the indicator moving higher from the comparatively low levels recorded in recent years, although conditions remain far removed from previous periods of severe labour-market weakness.

The annual comparison requires some caution. Registered unemployment in July was 0.4 percentage points higher than a year earlier, but part of that movement may be associated with changes to Poland’s employment-market regulations rather than an outright deterioration in labour demand. Adjustments to the rules governing removal from unemployment registers may have slowed the rate at which people leave the official statistics.

The underlying signals are consequently mixed. Half of the components used to construct BIEC’s indicator currently point towards the possibility of increasing unemployment, while the remainder suggest conditions could improve. There is therefore not yet sufficient evidence to describe Poland as entering a clear employment downturn.

More significant for businesses and investors is the change in corporate sentiment. Companies became less positive about their operating conditions in July after a temporary improvement a month earlier. Assessments remain predominantly negative, indicating that more businesses report worsening conditions than improvement.

Recruitment plans are similarly restrained. Companies have not materially increased their intentions to expand employment, with the balance of responses remaining negative. BIEC’s assessment suggests that a significant part of current recruitment may be associated with replacing departing employees rather than companies increasing overall headcount as they expand.

This distinction is important for the wider economy. Recruitment caused by normal staff turnover maintains employment but does not create the same additional demand generated by companies opening new operations, increasing production or expanding service teams. Persistently weak expansion-led hiring could therefore become an indicator of more conservative corporate investment decisions.

There are also early signs of pressure from company restructuring. The number of registered unemployed people who had lost their positions for reasons attributable to employers increased by 2% in July and has risen by more than 2,500 people since the beginning of the year. The numbers remain relatively small in the context of the national workforce, but their direction provides another indication that some businesses are encountering more difficult operating conditions.

Other labour indicators provide a more encouraging counterbalance. Following an increase in June, the number of people newly registering as unemployed fell by almost 6% in July. Vacancies reported to local employment offices increased by slightly more than 10%, although the overall number of available positions remains comparatively low.

The combination suggests that Poland is experiencing a gradual cooling rather than a sudden employment shock. Unemployment remains low, companies are still recruiting and the overall inflow into unemployment has not accelerated substantially. At the same time, businesses appear less willing to commit to significant additions to their workforces.

For commercial real estate, the changing labour environment could have different effects across sectors. A reduction in labour shortages may improve conditions for industrial, logistics and manufacturing companies considering expansion in regions where employee availability has previously constrained investment. For office markets, however, slower growth in corporate headcount could limit one of the traditional sources of additional space requirements.

Consumer-facing property will also depend on whether the slowdown remains moderate. Stable employment would continue to support household spending and retail property, whereas a more substantial increase in unemployment would eventually place greater pressure on consumer confidence and discretionary expenditure.

The next several months will therefore be important in determining whether the latest indicators represent temporary volatility or the beginning of a more sustained change in Poland’s employment cycle. BIEC itself emphasises that the evidence remains divided rather than pointing conclusively towards deterioration.

For employers and property investors, the message is consequently more nuanced than the unchanged 5.8% unemployment rate suggests. Poland’s labour market remains resilient, but businesses are becoming more cautious about adding staff. If that caution persists, the country could move from the exceptionally tight employment conditions of recent years towards a more balanced labour market in which employment growth becomes increasingly dependent on genuine business expansion rather than replacement hiring.

Swedish Retail Property Regains Momentum as Investors Favour Stronger Assets

Sweden’s retail property market accelerated sharply during the second quarter of 2026, with transaction volumes approaching four times their level a year earlier as improving consumer spending, firmer rents and lower investment yields encouraged capital back into the sector. The recovery, however, remains concentrated in stronger locations, leaving weaker retail properties facing a more difficult outlook.

Retail property transactions reached SEK 12.2 billion in Q2 2026, representing approximately 15% of total Swedish commercial real estate investment during the quarter. Twenty transactions were recorded. The first-half total reached SEK 14.9 billion, almost matching the SEK 15.3 billion transacted during the whole of 2025 and already exceeding annual volumes in both 2023 and 2024.

Several sizeable transactions contributed to the increase. Vendus acquired a portfolio of 51 retail properties for approximately SEK 2.7 billion in a transaction involving ICA Fastigheter and Bonnier Fastigheter Invest. ICA Fastigheter separately acquired another ten properties from Trecore with a value of around SEK 2.9 billion. International investors were also active, with a group of Norwegian buyers acquiring the 41,000 sqm Strömstad Shoppingcenter. Willys and Jysk together account for around half of the property’s rental income, illustrating the importance investors continue to place on established anchors and resilient income streams.

Investment pricing suggests that the increase in transaction activity is being accompanied by stronger competition for selected assets. Prime yields for grocery-anchored retail parks fell to 5.50%, 50 basis points below their level a year earlier. Non-grocery retail parks were priced at around 6.75%, also representing a 50-basis-point annual movement. Shopping-centre yields stood at 6.25% in Stockholm and 6.50% in Gothenburg, while Malmö remained at 7.25%. The differences demonstrate that improving sentiment has not removed the considerable pricing variation between markets and asset types.

Unlike a recovery driven exclusively by property capital, the improvement is being supported by stronger retail consumption. Sales volumes increased 2.2% between March and May compared with the preceding three months, with both durable goods and groceries increasing 2.5%. Compared with May 2025, overall retail volumes were 8% higher, with durable goods increasing 10.3% and grocery sales excluding Systembolaget rising 5.5%.

The improvement follows several difficult years for Swedish households, during which inflation and higher borrowing costs weakened purchasing power and encouraged consumers to postpone larger purchases. Household willingness to make major purchases has since recovered substantially from the lows of 2022 and 2023, although it remains below its longer-term average. The direction is therefore positive without yet representing a complete normalisation of consumer confidence.

Improving conditions are also becoming visible in the occupational market. Shopping-centre vacancy in Stockholm declined from 9.4% to 8.0%, while Gothenburg recorded a reduction from 6.8% to 6.3%. Gothenburg’s high-street vacancy fell from 3.0% to 1.5%. These movements suggest that stronger locations are beginning to translate the consumer recovery into better property fundamentals.

Prime rental growth provides another indication of the strengthening market. Stockholm shopping-centre rents reached SEK 9,500 per sqm annually, representing a 15.2% increase from a year earlier. Gothenburg increased 6.25% to SEK 8,500, while Malmö rose 5% to SEK 4,200. High-street performance was more varied. Stockholm remained by far the most expensive of the three cities at SEK 22,500 per sqm annually, although that level was unchanged year-on-year. Gothenburg was also stable at SEK 12,500, while Malmö recorded a 9.3% increase to SEK 4,700.

Retail parks present a more complicated picture. Prime rents for grocery-anchored properties stood at SEK 2,650 per sqm annually, up 1.9%, while non-grocery properties remained unchanged at SEK 2,350. The relatively modest movement in rents compared with the improvement in investment yields indicates that part of the change in asset pricing is being driven by greater investor confidence rather than a dramatic acceleration in underlying rental income.

More importantly, the recovery is not extending evenly across the market. Stronger retail warehouse locations continue to attract occupiers, while space in weaker secondary properties is considerably more difficult to lease. That distinction is likely to become increasingly important for investment values. Properties with established catchments, strong anchors, good accessibility and sustainable rental income can benefit from improving occupational conditions and greater competition between investors, while assets without those characteristics may experience little of the same uplift.

Sweden therefore appears to have moved beyond the most defensive stage of the retail property cycle. Capital is returning, yields for selected assets are tightening, consumer spending is recovering and the stronger rental markets are showing greater momentum. But the figures do not indicate a general revival across every part of the sector.

Instead, the recovery is reinforcing an increasingly selective market. The strongest properties are benefiting simultaneously from returning investment capital, improving consumer conditions and healthier occupational fundamentals, while weaker assets continue to face structural challenges. For the wider European property market, Sweden provides another indication that retail is becoming investible again after several difficult years, but location, tenant strength and the durability of income are increasingly determining which properties participate in the recovery and which are left behind.

Source: CBRE Sweden

front page info
LATEST NEWS