Sunday, 5 April 2026
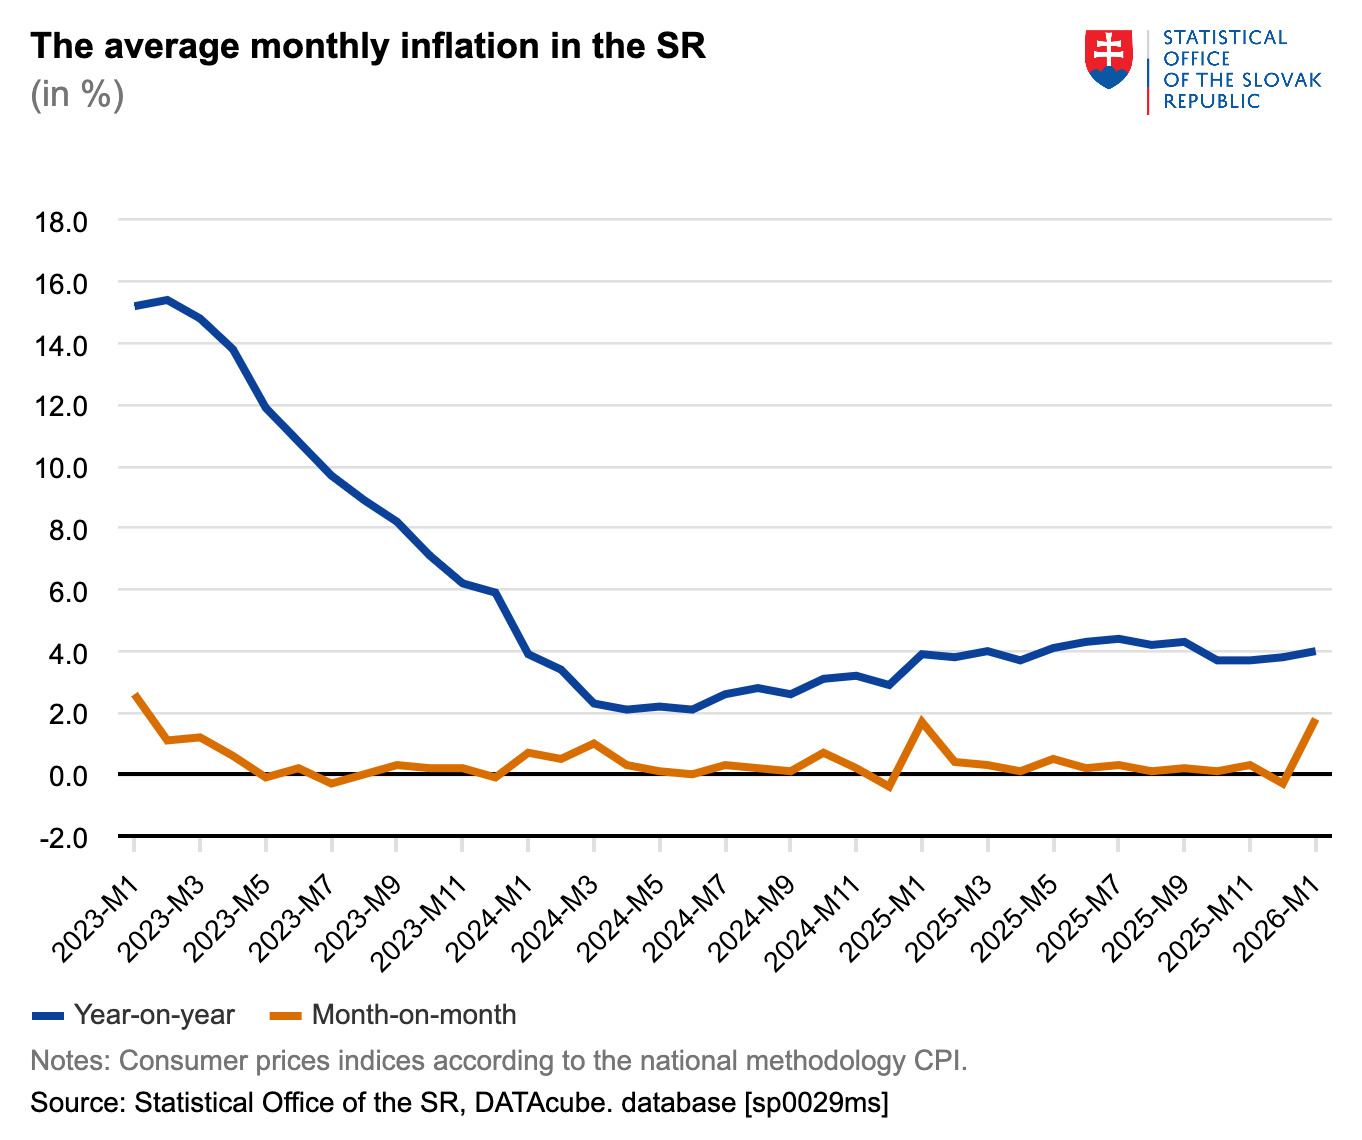
Consumer prices in Slovakia increased in January both compared with the previous month and the same period last year, with inflation reaching 4 percent on an annual basis. The rise was driven mainly by higher costs for housing, utilities and food, while fuel prices declined and seasonal retail discounts slightly reduced clothing and footwear prices.
According to data released by the Statistical Office of the Slovak Republic, prices of goods and services rose by 1.8 percent month-on-month, representing the steepest monthly increase in roughly three years. January typically records stronger price movements due to the introduction of new tax rules and adjustments to regulated tariffs at the start of the year.
The most significant monthly increase was recorded in housing-related expenses, where regulated energy price changes pushed overall costs sharply higher. Heating, gas and electricity all became more expensive, alongside water and sewage charges. Food and non-alcoholic beverages also posted noticeable growth, with fruit, vegetables and confectionery among the categories showing the largest jumps. Soft drinks and other beverages rose markedly following higher taxation on sugar content. Alcohol prices also increased during the month.
Smaller but still visible price growth was seen in leisure services and dining, while transportation costs eased due to lower fuel and airfare prices. Retail promotions at the beginning of the year contributed to a modest drop in clothing and footwear prices.
On a year-on-year basis, prices were higher across nearly all spending categories, with restaurants and hotels among the fastest-growing segments. Housing and food remained the two largest contributors to overall inflation due to their substantial share in household budgets. Energy-related costs recorded some of the strongest annual increases, particularly for district heating, while rents and maintenance expenses also moved upward. Non-alcoholic beverages rose significantly compared with a year earlier, partly reflecting higher coffee prices.
Transportation was the only major category to show an annual decline, supported by cheaper fuels and air travel.
The statistical office also introduced an updated consumer basket structure at the start of the year, expanding the number of expenditure categories and adjusting their weightings based on recent household spending patterns. Housing and energy now account for just under 22 percent of total expenditure, while food and non-alcoholic beverages represent about 21 percent.
Core inflation, which excludes regulated prices and administrative changes, stood below the headline rate, while net inflation, which also omits food, remained slightly higher than core levels. Additional detailed datasets are scheduled for publication later in the month.