Wednesday, 22 July 2026
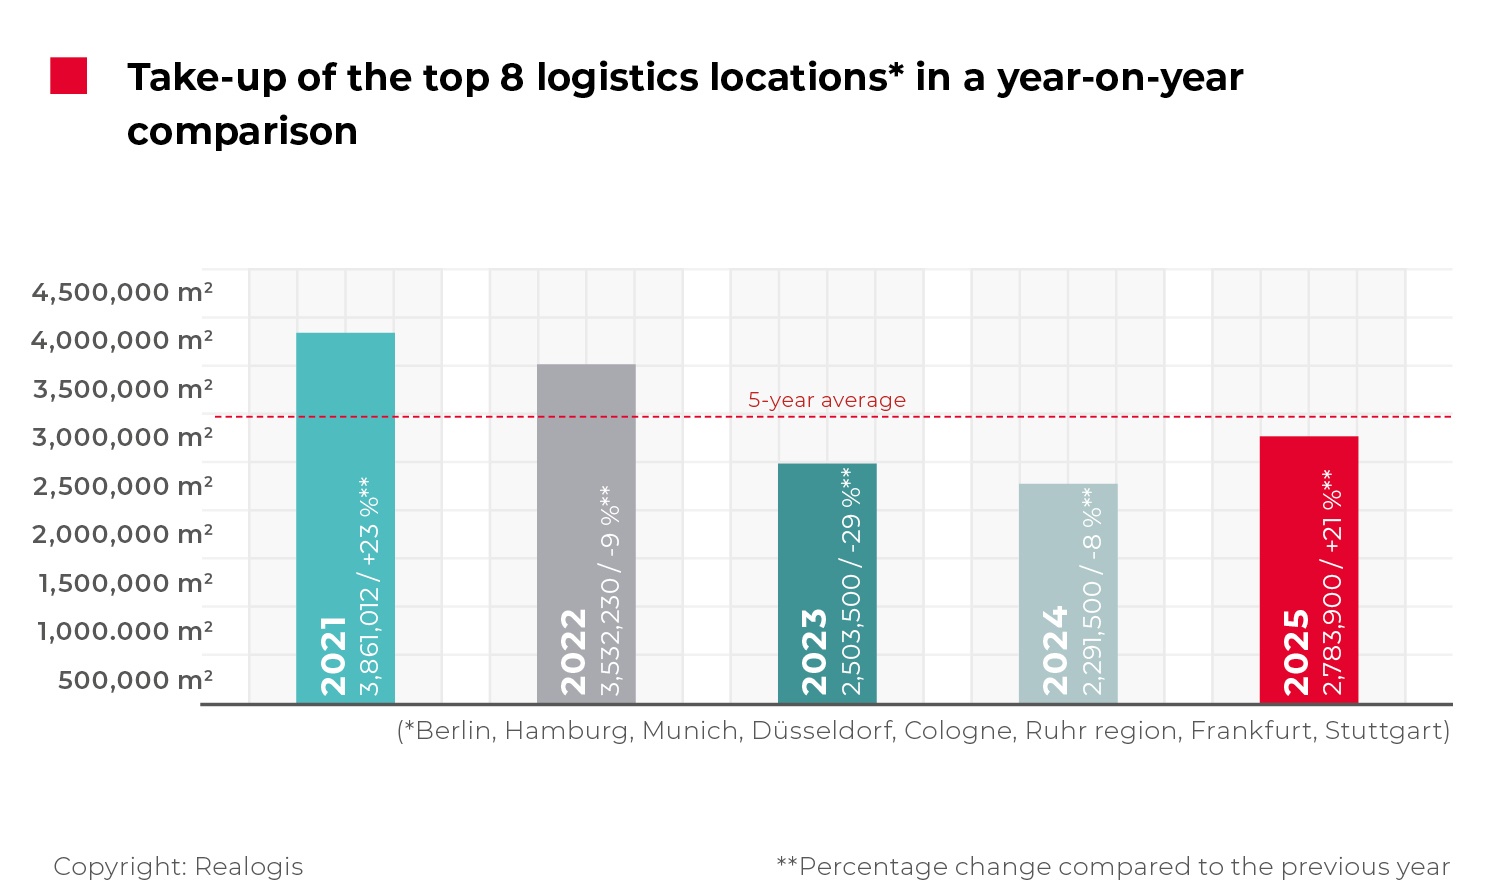
Logistics and industrial take-up across Germany’s eight major markets reached approximately 2.78 million sqm in 2025, representing a 21 percent year-on-year increase and marking a recovery after three consecutive years of decline, according to REALOGIS Unternehmensgruppe. The previous year had recorded the lowest level since 2014. The analysis covers Berlin, Düsseldorf, Cologne, the Ruhr region, Frankfurt, Hamburg, Munich and Stuttgart.
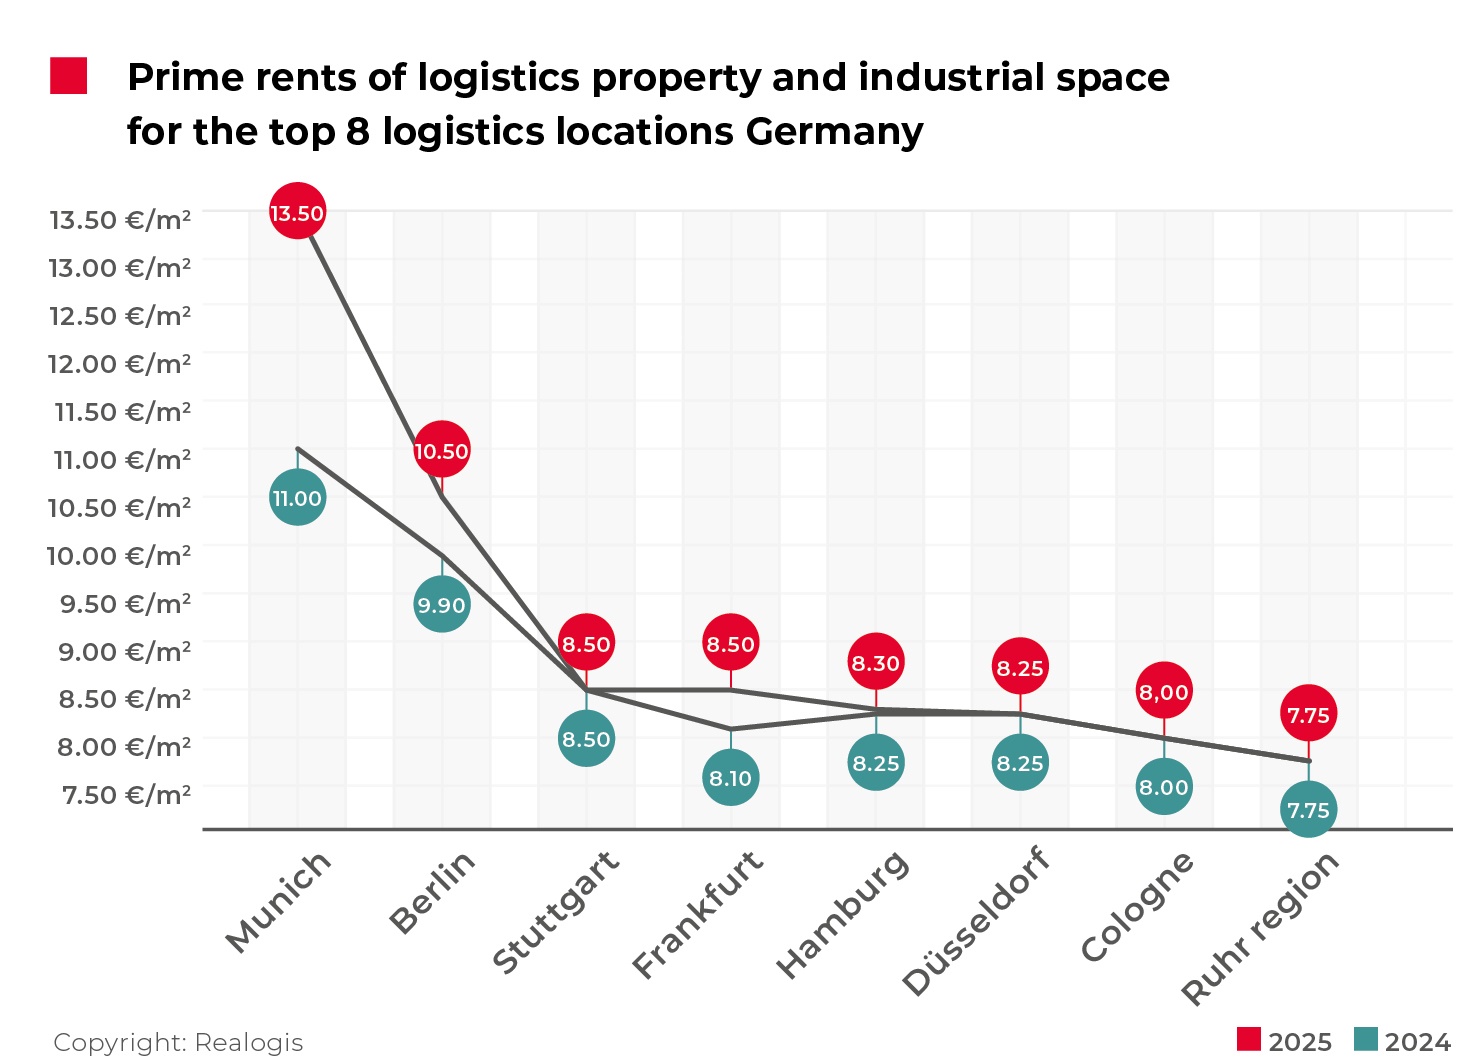
Rental performance across the markets showed mixed dynamics. Munich remained the most expensive location, with prime rents rising to €13.50 per sqm, an increase of €2.50 compared with 2024 and the strongest growth among the Top 8 markets. Berlin followed at €10.50 per sqm. Frankfurt and Stuttgart shared third position at €8.50 per sqm, with Frankfurt posting growth while Stuttgart remained stable year-on-year. Prime rents in Düsseldorf and Cologne held at €8.25 per sqm and €8.00 per sqm respectively, while Hamburg edged up slightly to €8.30 per sqm. The Ruhr region continued to offer the lowest prime rent level at €7.75 per sqm.
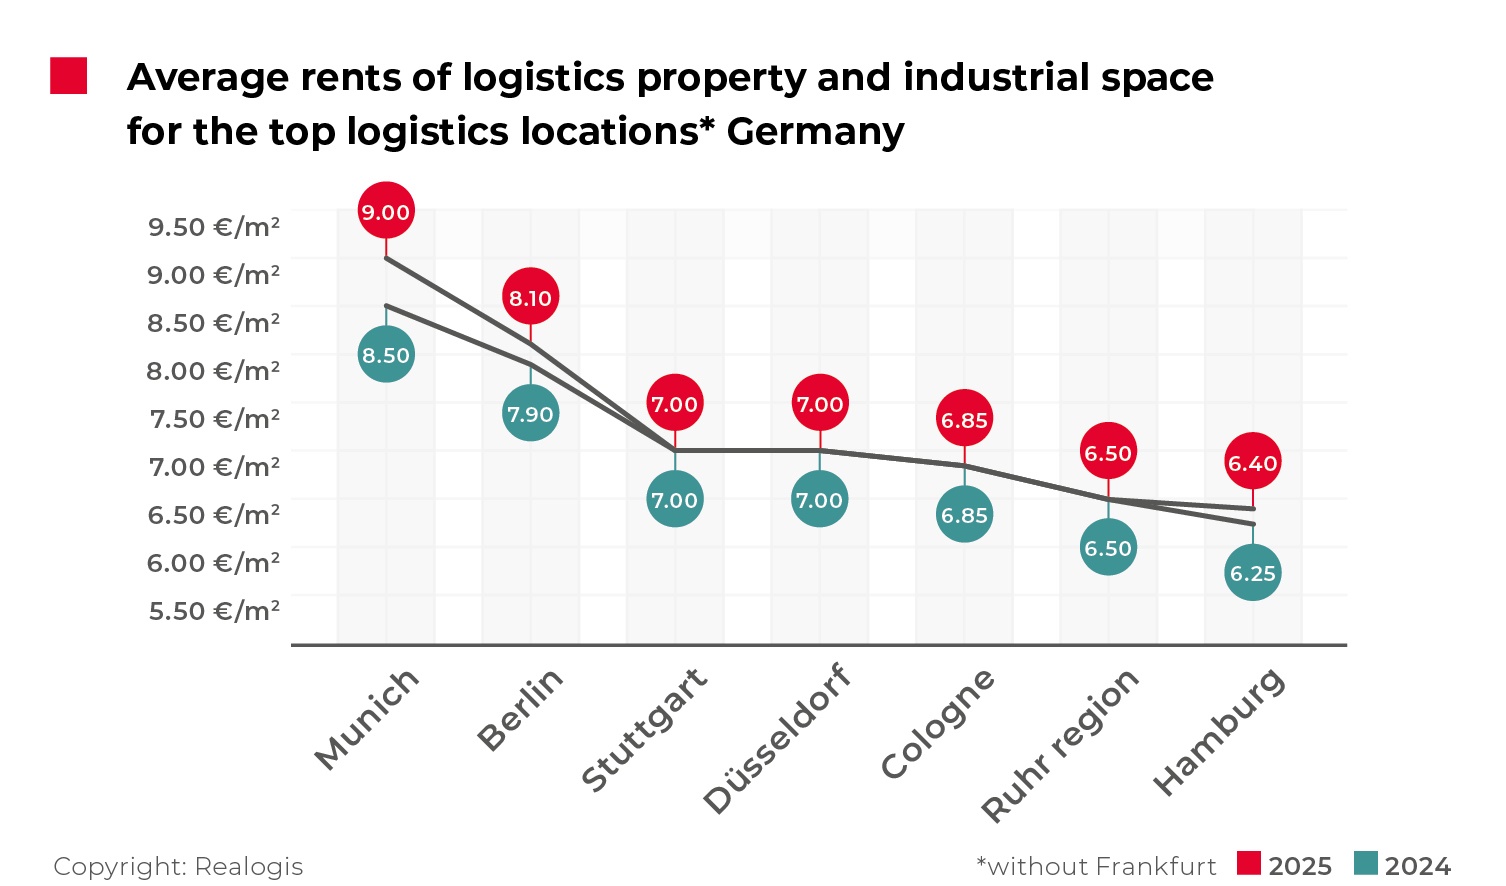
Average rents, excluding Frankfurt, increased modestly by around 2 percent compared with the end of 2024. Munich recorded €9.00 per sqm and Berlin €8.10 per sqm. Stuttgart and Düsseldorf each stood at €7.00 per sqm, followed by Cologne at €6.85 per sqm and the Ruhr region at €6.50 per sqm. Hamburg reported the lowest average rent at €6.40 per sqm.
After three years of contraction, take-up rebounded across the Top 8 markets in 2025, with the Ruhr region and Berlin posting the strongest percentage increases. The Ruhr region delivered the largest volume, contributing 603,200 sqm and accounting for 22 percent of total take-up. Frankfurt followed with 435,200 sqm, narrowly ahead of Berlin at 433,000 sqm. Compared with the five-year average, Munich and the Ruhr region exceeded their benchmarks, while Düsseldorf matched its average performance. Stuttgart recorded the weakest relative performance.
Leasing activity continued to dominate market structure. Tenant deals accounted for 94 percent of take-up, equal to 2.61 million sqm, while owner-occupiers represented just 6 percent, or 174,400 sqm. This distribution remained broadly unchanged compared with 2024.
By property type, big-box logistics space was the primary driver of activity, reaching 1.62 million sqm and representing a 58 percent share of total take-up. Space outside the big-box and business park categories totalled 758,900 sqm, or 27 percent. Business parks recorded 408,700 sqm, or 15 percent, and were the only segment to decline year-on-year, although this was more than offset by growth in other property types.
In terms of occupier structure, logistics and distribution companies were the most active group, accounting for approximately 1.33 million sqm, or 48 percent of total take-up, and overtaking retail as the leading sector. Retail and wholesale followed with 757,300 sqm, representing 27 percent. Within this segment, traditional retail accounted for 492,600 sqm, while e-commerce operators leased 264,700 sqm, a lower share than in the previous year. Manufacturing companies ranked third with 498,400 sqm, or 18 percent, showing moderate growth, while other sectors together represented 203,000 sqm.
Large units continued to dominate demand. Transactions for spaces of 10,001 sqm and above reached 1.54 million sqm, giving the segment a 55 percent market share. Units between 5,001 sqm and 10,000 sqm accounted for 475,000 sqm, meaning that almost three quarters of total take-up was concentrated in spaces above 5,000 sqm. Mid-sized categories between 1,000 sqm and 5,000 sqm declined slightly, while units below 1,000 sqm remained the smallest segment and recorded the sharpest fall.